Gold prices fell following renewed speculation that the Fed will taper QE in either December or January. This renewed furore surrounding QE tapering arose from what the Fed didn’t say in the latest FOMC statement, with scant mention of the negative economic impact from the recent US governmental shutdown. Market interpreted this as a sign that the Fed does not consider the $15 billion to $50 billion (depending on who you ask) economic damage the shutdown has dealt as important enough to delay their undisclosed QE taper timeline.
Hourly Chart
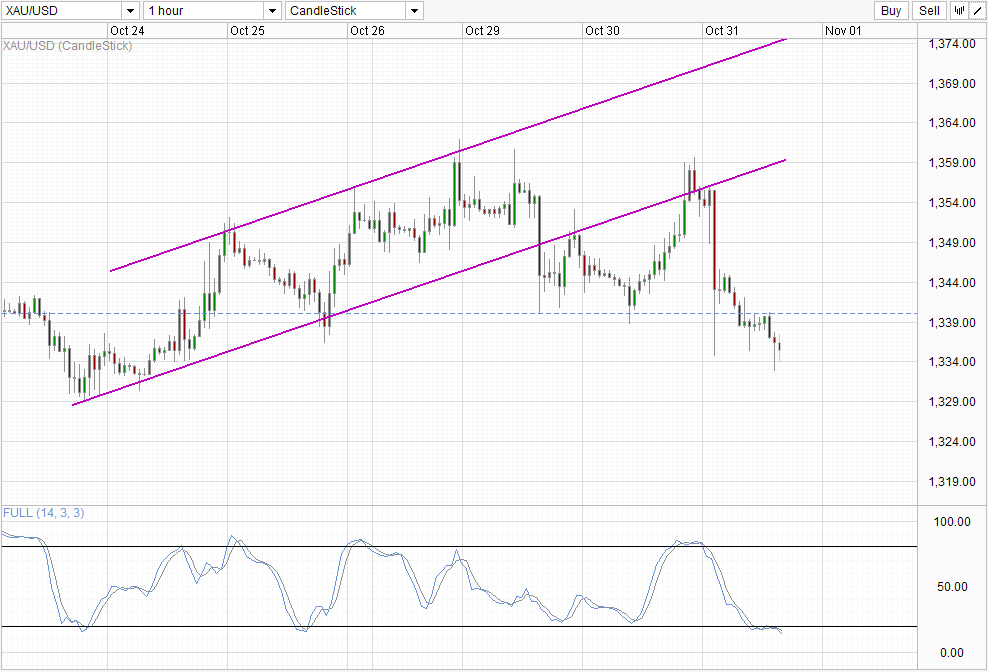
However, the decline wasn’t particularly outstanding. We did manage to trade below the 1,340 support briefly but prices rose back up higher within the hour following the announcement. In fact, by the time US session closed, gold prices were actually a tad higher than the lows of yesterday’s Asian session. The decline simply erased the gains that were made during early European session, which peaked during the early US session. There isn’t any strong reasons for gold to be appreciating during that period, hence we are forced to consider that the rally was driven by speculators pricing in a dovish FOMC scenario in advance. This would also mean that the post FOMC decline is simply a one time revaluation of Gold prices after speculators realized they’ve got it wrong, and not really a true bearish move. This fits nicely with what was observed above where market’s interpretation of Fed being “hawkish” is weak at best.
Nonetheless, by trading below 1,340, we could see short-term bearish momentum towards 1,330 support. Stochastic readings are currently within the Oversold region, but the holding of 1,340 support turned resistance has resulted in the Stoch curve currently pointing lower after rebounding off the 20.0 level, suggesting we could still yet see further bearish movement for now.
Weekly Chart
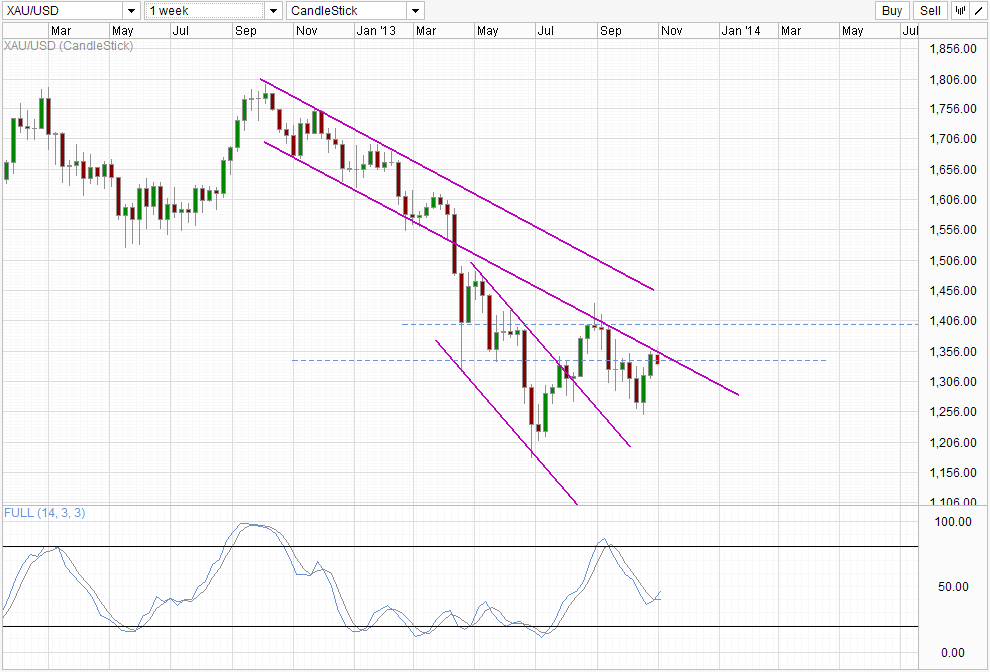
Weekly Chart is more bearish with the bearish rejection from Channel Bottom gaining traction. However, Stochastic readings continue to point higher, and ideally we should see price continuing lower further which will pull Stoch curve lower and at the same time giving us a Tweezers Top pattern which is a much stronger bearish signal than what we have currently.
If the ideal bearish scenario does not materialize, traders may wish to wait for price reaction early next week and see if broad market is seeing the same bearish technical signs as we are right now. Furthermore we will have the latest COT numbers on hand which will help us see if institutional speculators have given up on their long positions – an important factor if strong bearish follow through are to take place.
More Links:
WTI Crude Technicals – Remaining Bearish But Sideways Trend Possible
NZD/USD – S/T Sideways Trend Intact Despite Hawkish RBNZ and FOMC
GBP/USD – Takes a Breather from Fall below 1.6050
This article is for general information purposes only. It is not investment advice or a solution to buy or sell securities. Opinions are the authors; not necessarily that of OANDA Corporation or any of its affiliates, subsidiaries, officers or directors. Leveraged trading is high risk and not suitable for all. You could lose all of your deposited funds.

Mingze Wu
Latest posts by Mingze Wu (see all)
- European Bourses Not Enjoying Bullish Winds From US Stocks - 17 April 2014
- More Aggressive Stimulus Possible Despite Premier Li’s Denial - 17 April 2014
- China March FDI -1.5% Y/Y vs +2.05% expected. First decline in more than a year. - 16 April 2014