S&P 500 ended lower yesterday, extending the losses incurred post a more hawkish than expected FOMC outcome on Wednesday. The actual physical stock index fell by 0.38% D/D, but looking from the perspective of Futures, yesterday decline does not appear to be of any great significance.
Looking at the Hourly Chart below, we can see that prices remain above the post FOMC lows. In fact, price action during early US session was bullish, as traders managed to shrug off early session losses led by a worse than expected Initial Jobless and Continuing Claims, and traded above Wednesday’s pre FOMC levels for a brief moment.
Furthermore, unlike Russell 2000 and Nasdaq index which both showed “inside day” candles, S&P 500 did not share the same bearishness bias, which underlines the strong support seen in S&P 500 – a good characteristic that will allow prices to outperform the rest of the market should broad market sentiment returns bullish.
Hourly Chart
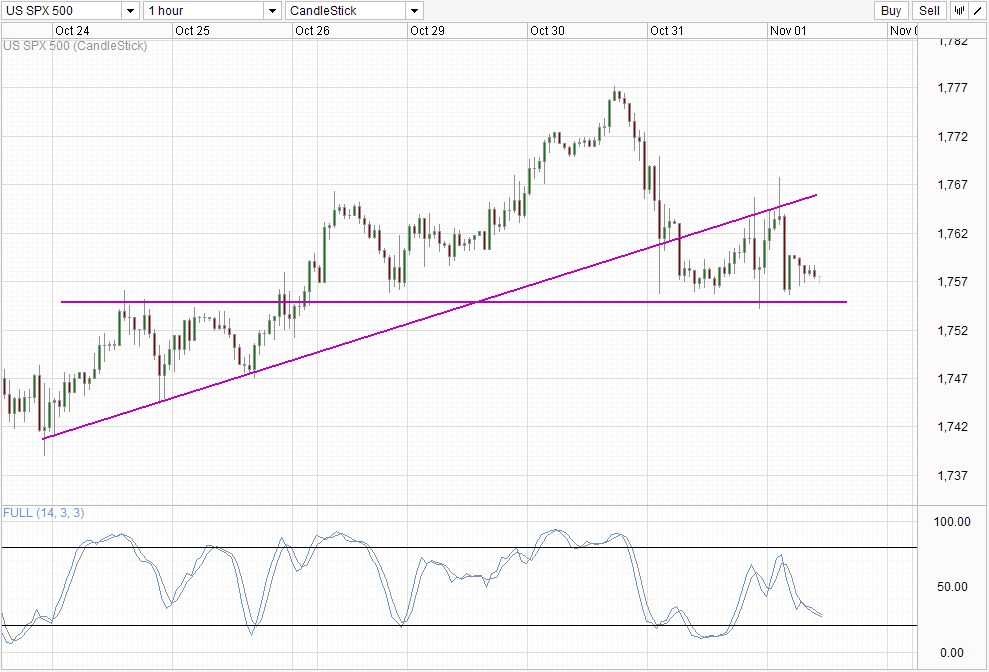
However it should be noted that bearish risks remain. Generally it is unlikely that a broad market stock index will be able to go against market trends for long. From a relative basis, S&P 500 may well certainly outperform but that doesn’t mean that prices will not be able to trade lower from here.
There are some technical signs as well – prices failed to climb above the rising trendline that has been supporting the rally since 24th Oct, telling us that bullish impetus is absent currently. Hence, if 1,755 support is broken, traders need to be prepared that more losses may follow as that would mean that the decline post FOMC is having initiative.
Daily Chart
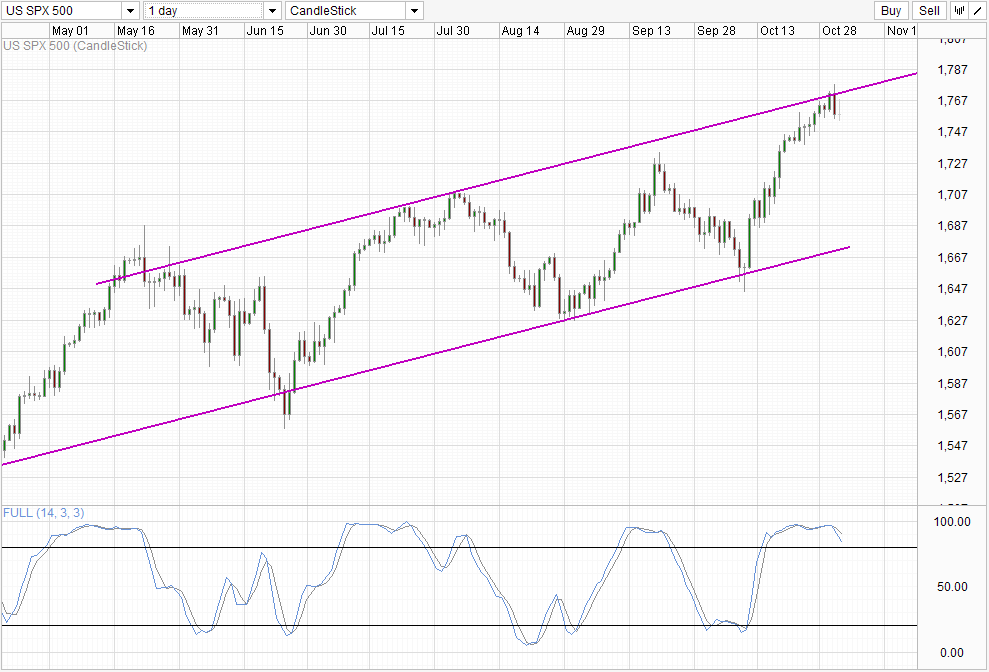
This is echoed by Daily Chart which shows prices facing resistance from Channel Top. Stochastic curve on the Daily is also topping, favoring a bearish cycle from here which opens up a move towards Channel Bottom especially if the swing high of September is broken – which will most likely coincide with Stochastic pushing below 80.0.
Fundamentally, earnings per share for stocks have been falling. EPS growth for 2013 was expected to be 10%, but was slashed by almost half to 5.6%. Furthermore, even though 2/3 of S&P 500 stocks have beaten earnings expectations in Q3, the targets that they have surpassed were previously revised lower and would have missed the original targets. This trend appears to be holding for Q4 as well. Market is certainly very bullish and perhaps too optimistic compared to historical behavior, increasing the likelihood of a bearish correction eventually.
More Links:
GBP/USD – Finds Support at 1.60
AUD/USD – Continues to Drift Lower below 0.95
EUR/USD – Drops Sharply to Two Week Low below 1.36
This article is for general information purposes only. It is not investment advice or a solution to buy or sell securities. Opinions are the authors; not necessarily that of OANDA Corporation or any of its affiliates, subsidiaries, officers or directors. Leveraged trading is high risk and not suitable for all. You could lose all of your deposited funds.

Mingze Wu
Latest posts by Mingze Wu (see all)
- European Bourses Not Enjoying Bullish Winds From US Stocks - 17 April 2014
- More Aggressive Stimulus Possible Despite Premier Li’s Denial - 17 April 2014
- China March FDI -1.5% Y/Y vs +2.05% expected. First decline in more than a year. - 16 April 2014