Hourly Chart
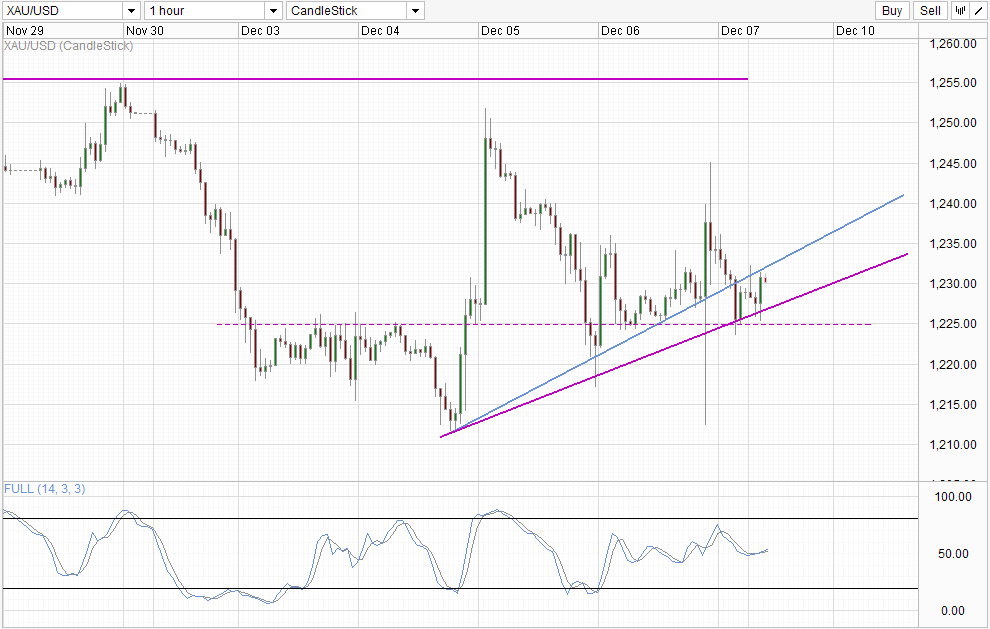
Gold prices took a hit last Friday after US NFP came in much stronger than expected, clearing the 200K barrier necessary for additional QE Taper fears to take flight. However, prices rebounded quickly with gold prices ending up much higher than pre NFP announcement, hitting a day high of 1,245 before tumbling down to 1,225 support for the rest of Friday’s trading session.
It should be noted that there isn’t any fundamental reason why Gold prices should be trading higher during the period of the spectacular rise, and we are once again leaved with the explanations of “bargain hunters” seeking to buy Gold at a low price keeping prices afloat. Price action supports this assertion, as the quick decline that followed the failed test of 1,240 – 1,245 resistance showed that bullish sentiment isn’t prevalent in the market. The fact that the initial NFP decline stopped just around last week’s swing low of 1,212 also support the hypothesis, as prices rebound at a typical area where bulls would naturally prime their buy orders. Furthermore, this sort of behavior has been observed last week making it 3 strikes for the hypothesis to float.
That this implies is that we should not be expecting further strong bullish rallies coming out of Gold in the short-term, as it is unlikely that the buyers that have triggered the strong rebound will have enough clout to keep buying indefinitely. Hence, the only way for Gold to continue rally would be if the overall sentiment of the yellow metal has shifted from one of bearish to that of bullish – of which there is no evidence that it is taking place now.
Looking at technicals, depending on how one draws the upward trendline, there will be varied degrees of bearishness. Traders who believe that the blue line has more relevance to price structure will interpret current chart to be more bearish, as this morning’s rally have failed to break higher into the rising trendline, which opens up 1,225 as the bearish target once again. On the other hand, traders who prefer the purple line would be looking at a potential move towards 1,245 – 1,255 once again. However, no mater which is your preference, bearish pressure will remain in play below 1,255, and bullish pressure above 1,225.
Daily Chart
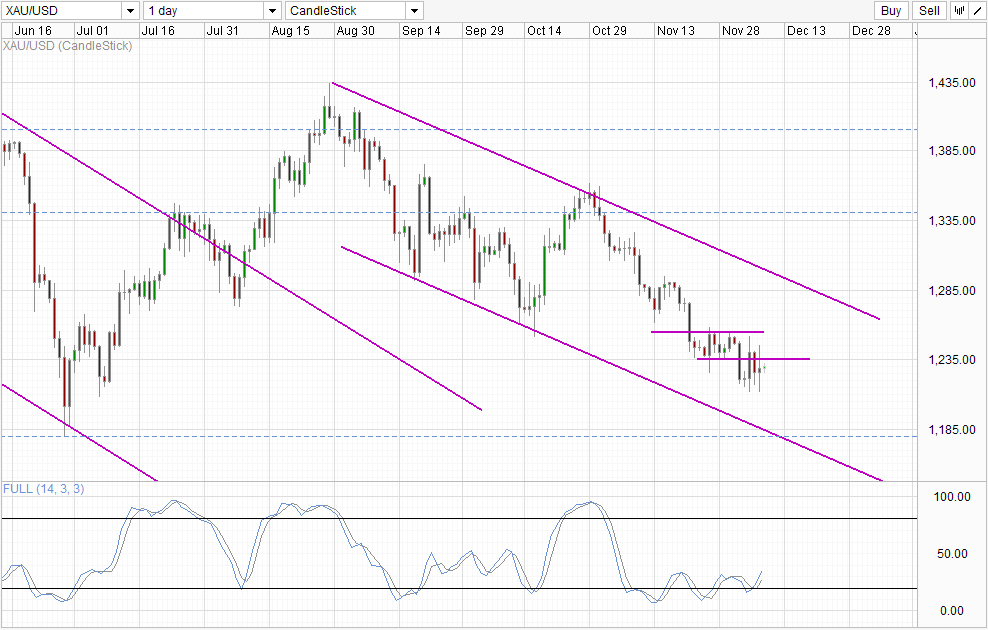
Daily Chart is still bearish, with Channel Bottom the bearish target. However, Stochastic indicator shows that a short-term recovery cycle may be underway with Stoch curve breaking the “resistance” of 30.0, and opens up a short-term recovery cycle until 50.0 – in concordance with price potentially finding resistance between 1,235 – 1,255. Therefore, short-term bullish movement should not be ruled out even though long-term direction is still bearish.
More Links:
GBP/USD – Settles Around Key Level of 1.6350
AUD/USD – Shows Some Resilience Moving above 0.91
EUR/USD – Moves to Six Week High above 1.37
This article is for general information purposes only. It is not investment advice or a solution to buy or sell securities. Opinions are the authors; not necessarily that of OANDA Corporation or any of its affiliates, subsidiaries, officers or directors. Leveraged trading is high risk and not suitable for all. You could lose all of your deposited funds.

Mingze Wu
Latest posts by Mingze Wu (see all)
- European Bourses Not Enjoying Bullish Winds From US Stocks - 17 April 2014
- More Aggressive Stimulus Possible Despite Premier Li’s Denial - 17 April 2014
- China March FDI -1.5% Y/Y vs +2.05% expected. First decline in more than a year. - 16 April 2014