Hourly Chart
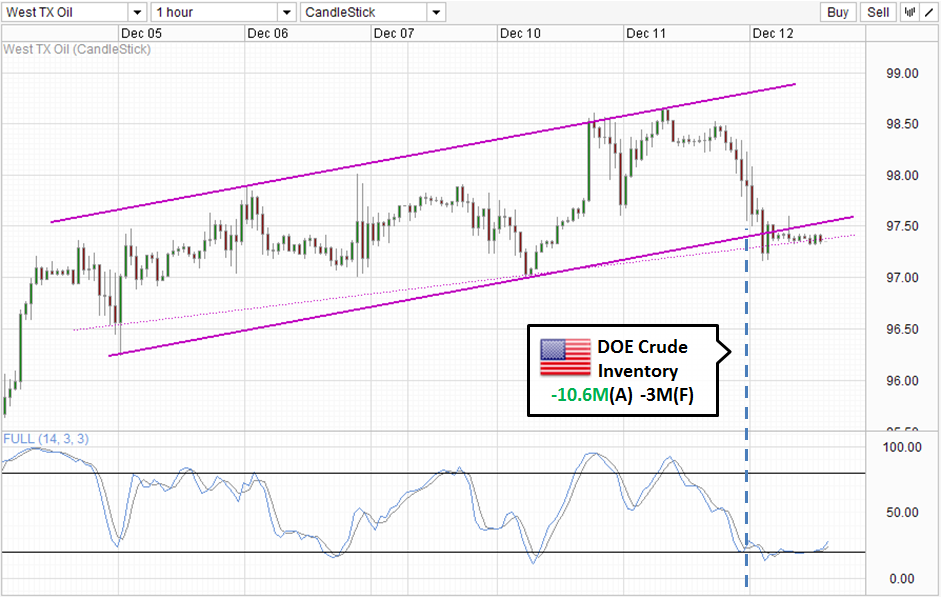
US Crude prices declined yesterday despite Department of Energy numbers showing the largest weekly inventory draw down of 2013. Not only is this number larger than the original expectations of a 3 million barrels decline, the official 10.6M decline is much higher than the American Petroleum Institute’s 7.5 million which was released on Tuesday. This is a sign of strong bearish sentiment in WTI, and suggest that we could see further bearish sell-off should any economic numbers trigger broad risk-off sentiment.
But before we get ahead of ourselves, it is important to note that yesterday’s numbers were not all rosy. Distillate Inventory and Gasoline Inventories both increased more than expected, with the latter increasing the most since Jan 2013. This reflect a lower implied demand for energy products from end consumers which would definitely affect Crude demand in the future. Perhaps even more crucial is the increase in Crude Inventory to the tune of 625K in Cushing Oklahoma – the main delivery point of WTI Crude. This increase is surprising as the recent Keystone Pipeline completion announcement has drove WTI prices higher and as traders assumed that the pipeline will be able to draw higher demand of WTI Crude. Hence, it is likely that a portion of traders who have bought after the announcement may have closed out their positions, resulting in additional bearish pressure on prices yesterday, and therefore we should not be too harsh to bulls for collapsing in the face of the bullish DOE headline number.
Nonetheless, prices is undoubtedly bearish right now after breaking the rising Channel Bottom, with 2 attempts to climb back into the Channel failing. There is still some support above 97.0 for now, but strong bearish acceleration may take place if 97.0 is broken. Stochastic indicator is kinder to bulls – suggesting that bearish momentum has been oversold and a bullish pullback phase is underway now. However, with Stoch curve having its own “resistances” around 35.0 and 50.0, it will not be surprising to see Stoch curve reversing at these aforementioned levels.
Daily Chart
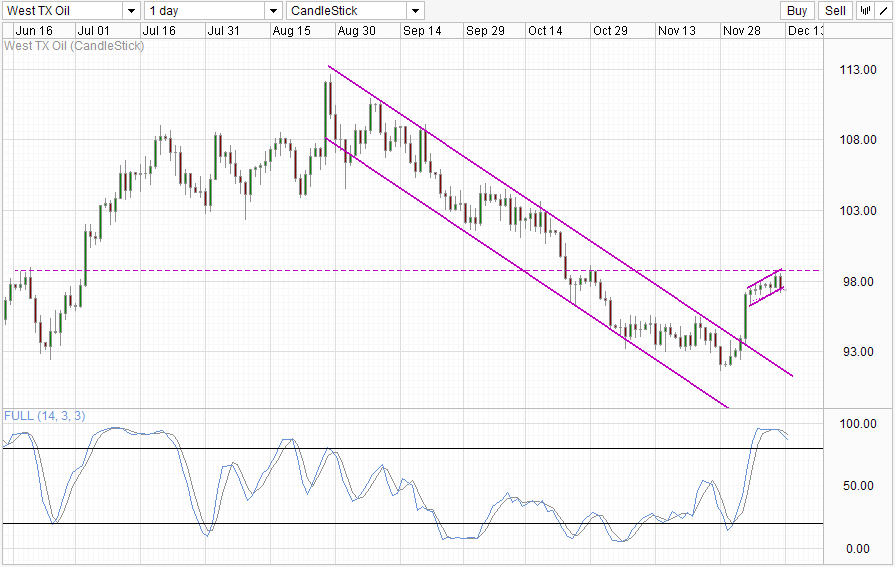
Daily Chart shows that price is Overbought and is in the midst of correcting lower after failing to breach resistance at 99.0. Keep in mind there is no bearish signal from Stochastic though, as Stoch curve is still above the key 80.0 level. Similarly, prices will need to clear the support around 97.0 in order for stronger bearish conviction to emerge. Descending Channel Top will be the obvious bearish objective with interim support expected around 95.0 – 95.5 and 93.0.
More Links:
GBP/USD – Falls Sharply From Resistance Level at 1.6450
EUR/USD – Eases Back from Resistance Level at 1.38
AUD/USD – Bearish Despite Stronger Employment Numbers
This article is for general information purposes only. It is not investment advice or a solution to buy or sell securities. Opinions are the authors; not necessarily that of OANDA Corporation or any of its affiliates, subsidiaries, officers or directors. Leveraged trading is high risk and not suitable for all. You could lose all of your deposited funds.

Mingze Wu
Latest posts by Mingze Wu (see all)
- European Bourses Not Enjoying Bullish Winds From US Stocks - 17 April 2014
- More Aggressive Stimulus Possible Despite Premier Li’s Denial - 17 April 2014
- China March FDI -1.5% Y/Y vs +2.05% expected. First decline in more than a year. - 16 April 2014