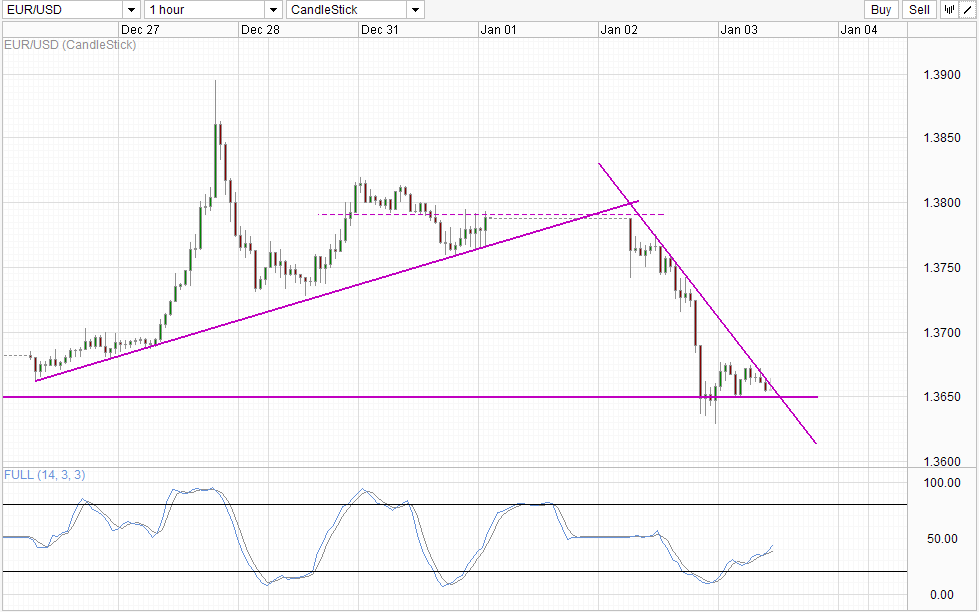
Prices took an even stronger tumble during European session yesterday following an early tumble during Asian hours. However, since then prices have stabilized during the US trading session even though risk appetite was low with S&P 500 losing 0.89% during the same period. Hence, the decline in EUR/USD is clearly not inspired by “risk off” flows.
This assertion is further evidenced when we consider that prices declined the strongest after stronger than expected PMI numbers from Germany, Spain and Euro-Zone overall have been released, which makes it clear that the move isn’t fundamentally driven.
Hourly Chart
Technical influences become the next best reason, and in fact the only reason to explain yesterday’s decline. It is no coincidence that the sharpest decline yesterday came after the soft support of 1.373 (Monday’s support level) was confirmed broken with a failed bullish push to climb back above it. Also, prices managed to stabilize around 1.365 – a support/resistance level that was in play after the Fed announced the QE tapering decision on 19th and 20th Dec. The dip also coincide with Stochastic readings entering the Oversold region, with current bullish rebound matching the bullish cycle signal.
Even though price has stabilized, strong bearish pressure remain and we may be on the verge of the next bearish leg. From a pure technical perspective, prices remain bearish as current bullish pullback wasn’t able to stay above the soft resistance of 1.367 which was the lows of 26th Dec. This increases the possibility of prices being pushed lower by descending trendline for a retest of 1.365. Should the support level breaks, the post Fed taper lows of 1.3625 will open up as a bearish target once again. Stochastic readings do no rule out a bearish turn from here as Stoch curve still have its own “resistance” to face between 40.0 – 50.0, which incidentally is the dip seen on 26th, the same reference point as 1.367 mentioned earlier.
That being said, a bullish revival cannot be ruled out as well. Should 1.365 holds, a push towards 1.37 becomes possible especially since we are in a bullish Stoch cycle right now. Furthermore we need to consider that there isn’t really good reasons for the strong sell-off in EUR/USD yesterday, hence there may be the possibility of overextension by bears. This is especially true when we look at other major pairs such as AUD/USD and GBP/USD, where price action isn’t consistent. It is clear that market is not coherent right now and any suggestion of strong directional follow-through need to be taken with a pinch of salt.
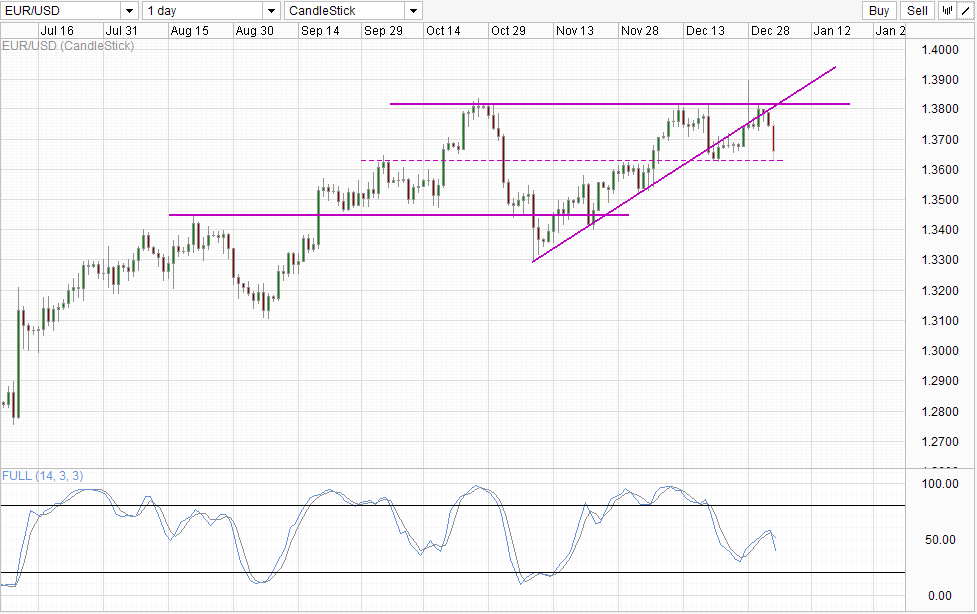
Daily Chart
Daily Chart is bearish but stronger bearish conviction will only come if 1.3625 is broken, and with it comes the formation of a Triple Top pattern. Stochastic readings are pointing lower right now but similarly Stoch curve should ideally breach the 30.0 – 30.5 “support band” to indicate that bearish cycle is on its way. Without which a rebound towards 1.3815 cannot be ruled out entirely, and considering that such a move will not invalidate overall bearish pressure, it is unlikely that bears will fight strongly against it. On the other hand, expect bulls to defend 1.3625 as if their lives depend on it as that would open up a possible move all the way to 1.31.
More Links:
USD/JPY – Rangebound to Start New Year
GBP/USD – Steady As UK Manufacturing PMI Dips
This article is for general information purposes only. It is not investment advice or a solution to buy or sell securities. Opinions are the authors; not necessarily that of OANDA Corporation or any of its affiliates, subsidiaries, officers or directors. Leveraged trading is high risk and not suitable for all. You could lose all of your deposited funds.


