EUR/USD managed to rally yesterday despite weaker than expected German Service PMI and Consumer Price Index. Prices did have a slight bearish pullback during early US session but that has nothing to do with the 2 aforementioned economic data, and appears to be a mild bearish pullback after 1.36 was broken. The subsequent affirmation of 1.36 resistance turned support sent prices up even higher once again, allowing price to hit the next resistance level of 1.3645. This push is further fuelled by weaker than expected ISM Non-Manufacturing Composite number which weakened USD on slight speculative play that the new Fed Chairman Janet Yellen (who incidentally would be voted in by the Senate later) may go easy on the QE tapering lark. However, 1.3645 held despite a handful of attempts to break it, keeping overall bearish bias intact and EUR/USD has been trading lower since US session ended.
Hourly Chart
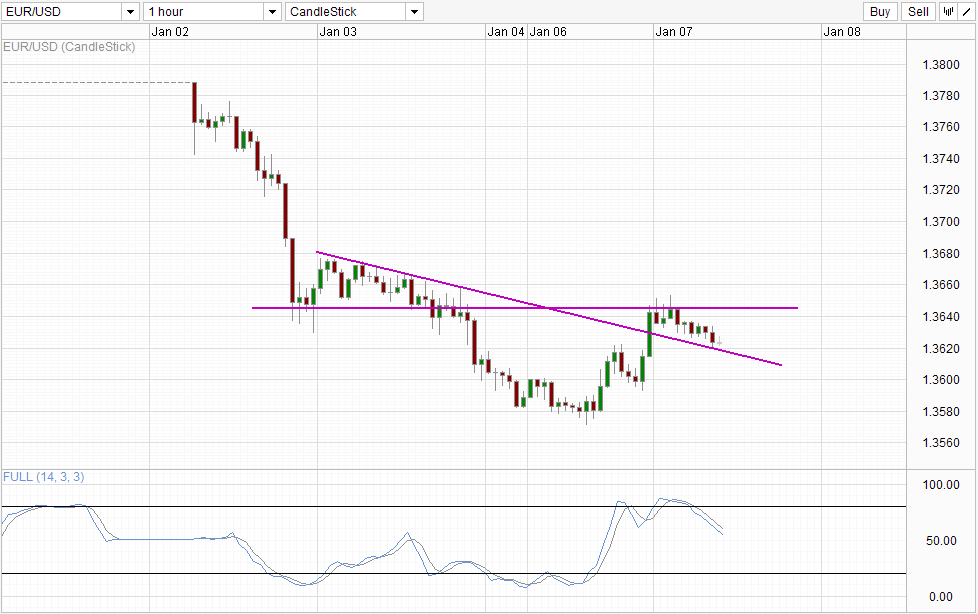
With all things considered, it is difficult to see yesterday’s rally as anything but a S/T corrective move. Firstly, prices did advanced lower and hit a low near 1.357 before the sudden pullback happened. This was already expected from a technical perspective as price was bearish but a pullback was always in the books considering that price haven’t had a significant bullish response ever since the turn of the new year. Furthermore, with a potential Triple Top pattern forming on the Daily Chart, a retest of the 1.363 support turned resistance (seen in Daily Chart) is actually welcomed by bears as this would allow bears to size up the measure of bulls and help to confirm the Triple Top.
Moving forward in the short-term, Stochastic indicator affirms the overall S/T bearish bias with Stochastic curve in the midst of a bearish cycle with Stoch levels already below the recent interim trough seen during the bearish pullback. This suggest that bearish conviction is stronger than before and favors a continued bearish push along the descending trendline.
Daily Chart
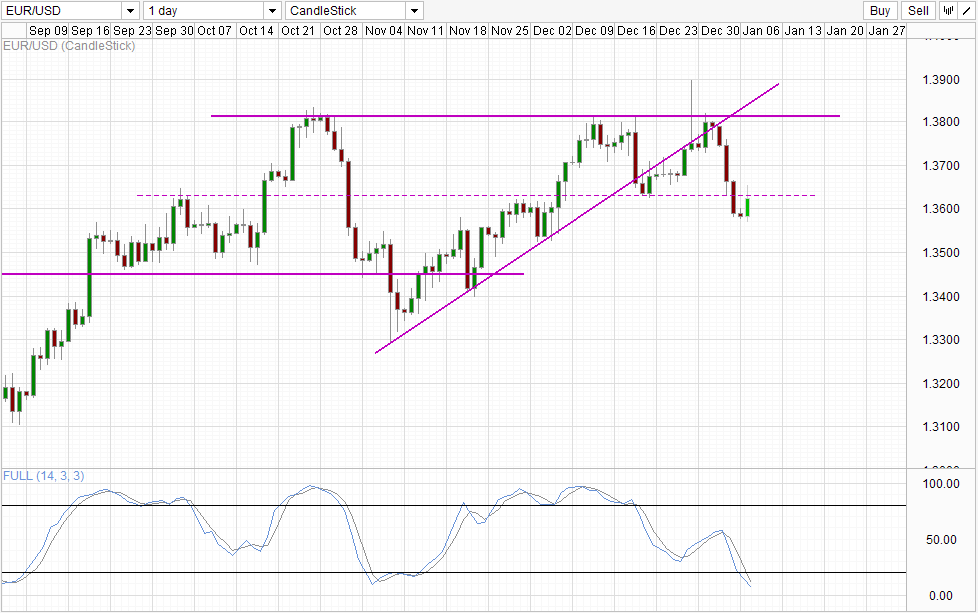
Speaking of the Triple Top pattern, should we close today’s candle below 1.363 accompanied by a bearish candle the next day, the Triple Top pattern will be confirmed. However, Stochastic readings are firmly within the Oversold region and there is a chance that prices may stay between 1.353 and 1.363 (consolidation between late Nov and early Dec) for an extended period of time before the next leg of bearish extension starts. This will allow bears to rest after the strong slide down from 1.38 and Stochastic readings will most likely push up and primed for the next bearish cycle.
More Links:
GBP/USD – Pound Active as UK, US Services PMIs Dip
Central Bankers Kick Start An Important Week
AUD/USD – Little Movement to Start Off Week
This article is for general information purposes only. It is not investment advice or a solution to buy or sell securities. Opinions are the authors; not necessarily that of OANDA Corporation or any of its affiliates, subsidiaries, officers or directors. Leveraged trading is high risk and not suitable for all. You could lose all of your deposited funds.

Mingze Wu
Latest posts by Mingze Wu (see all)
- European Bourses Not Enjoying Bullish Winds From US Stocks - 17 April 2014
- More Aggressive Stimulus Possible Despite Premier Li’s Denial - 17 April 2014
- China March FDI -1.5% Y/Y vs +2.05% expected. First decline in more than a year. - 16 April 2014