Stocks took another tumble yesterday. S&P 500 shed 8.73 points (0.49%), while Dow Jones Industrial Average was 41.23 points (0.26%) lower. Tech heavy index Nasdaq 100 which has a higher sensitive to risk trends, not surprisingly was the biggest loser at 32.46 (0.92%) lower when the US exchanges closed.
However, even though yesterday’s decline extended the losing streak to 3 consecutive days, price action isn’t as bearish as the losses suggest.
Hourly Chart
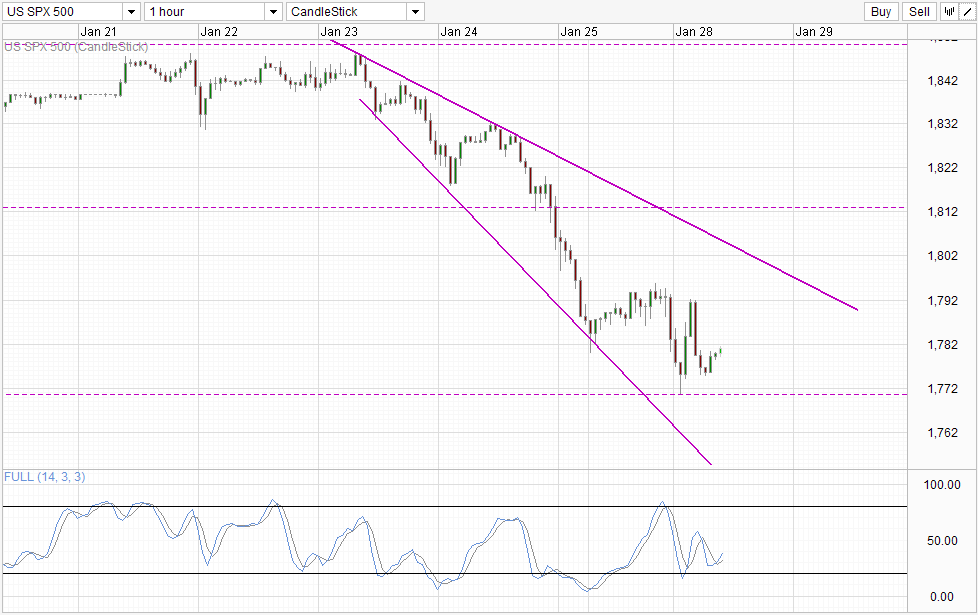
Looking at S&P 500 Futures, we can see that prices during Asian ad early European hours were mildly bullish. This can be interpreted as a short-term bullish pullback/correction, and does not represent a shift in overall sentiment, but certainly this development showed that bearish momentum is stalling. This point is even stronger when we note that Asian and European stock indexes were trading extremely bearishly during that time.
Unfortunately for bulls and fortunately for bears, prices actually traded lower once more on weaker than expected Dec New Home Sales data (-7.0% vs -1.9% expected), triggering the sell-off once more. However, even in this case prices tumbled much lesser compared to Thursday and Friday from a peak to trough basis, and prices actually recovered very quickly – rebounding off 1,770 and pushing back to 1,792. The incumbent broad bearish sentiment won out in the end, resulting in S&P 500’s 0.49% loss, but it is clear that bearish sentiment isn’t as strong as what it used to be.
Currently, prices are rebounding higher once again even though Asian stocks are trading lower similar to yesterday. Should sentiments remain the same, it will not be too surprising to see prices pushing up higher to 1,785 soft resistance. The likelihood of price eventually hitting 1,770 round figure is high, but given that bearish momentum is not as strong as it was, expect 1,770 to put a more of a fight and any subsequent bearish push from here may result in strong bullish pullbacks as well.
Fundamentally, with President Obama’s State of the Union address happening tonight and FOMC meeting announcement occurring the day after (Thursday Asian hours), the mild bearish outlook fits nicely as it is unlikely that traders will want to commit too aggressively. Also, upside risk in the immediate S/T remains as traders who have shorted earlier may wish to cover their positions ahead of the 2 major event risks.
Daily Chart
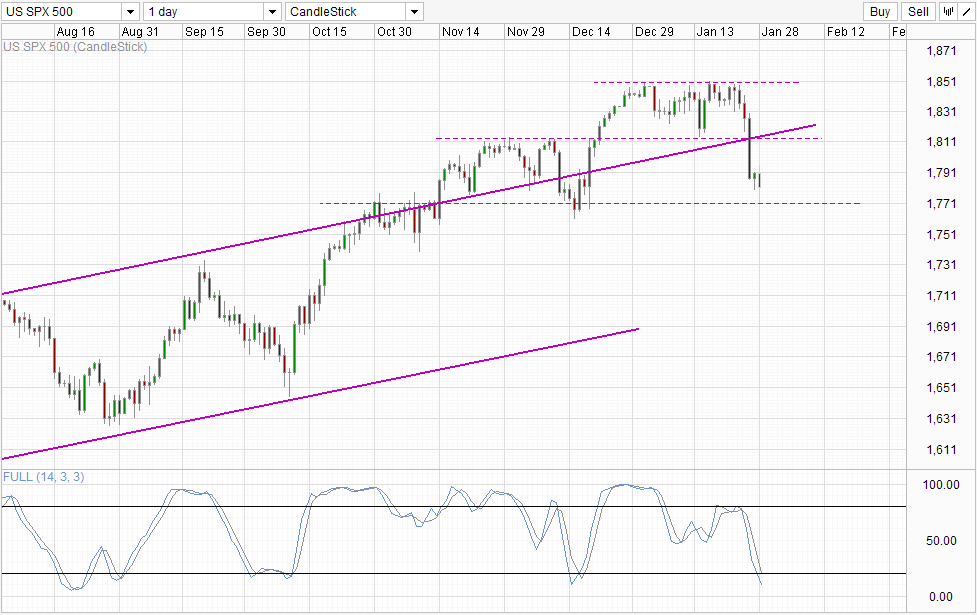
Stochastic on the Daily Chart agrees with the slowing bearish momentum. Stoch curve is already within the Oversold region, favoring a reversal soon as we approach (rebound?) from 1,770. However, should 1,770 breaks, the long-term bullish trend will be impaired, and we could see deeper bearish correction.
There are signs on the wall as well. Latest numbers from NYSE showed that leveraged ratio of its members have reached the highest on record, way above the leverage levels of 2006 – 2007 before the financial crisis. In fact, leverage levels has already exceeded the aforementioned levels for most part of 2013. Hence it is not wrong to say that current inflated prices is largely fuelled by credit, which will burn up quickly should stock prices start to decline and the dreaded margin calls start ringing. Should this really happen, a quick move towards 1,500 is not impossible.
More Links:
GBP/USD – Surges to Key 1.66 Level
AUD/USD – Rallies Back to 0.8750
EUR/USD – Steady Below Resistance at 1.37
This article is for general information purposes only. It is not investment advice or a solution to buy or sell securities. Opinions are the authors; not necessarily that of OANDA Corporation or any of its affiliates, subsidiaries, officers or directors. Leveraged trading is high risk and not suitable for all. You could lose all of your deposited funds.


