WTI is behaving weird as it did follow either risk trends nor fundamental drivers yesterday. Prices moved lower during US session even though stocks were actively trading higher during the time period. Also, latest Department of Energy’s latest weekly report reflected a much lower Crude Inventory build up compared to consensus estimate of 2.5+ million barrels.
Perhaps market wasn’t as bullish as expected as the reported gain of 0.44 million barrels is higher than the American Petroleum’s number of 0.38 Million which was published 1 day before, but a mere difference in 0.06 million barrels shouldn’t constitute a major bearish factor. Other numbers aren’t that far out either – Cushing official supplies number shrunk by 1.55 million vs API’s 1.6 million, while Distillates have a drawdown of -2.36 million vs -2 million reflected in API’s private report. The only significant difference between API numbers and DOE numbers was Gasoline – where actual numbers showed a rise of 0.5 million barrels but the private survey actually reflected a decline of 1.5 million barrels. But again, generally Gasoline inventory traditionally does not impact price of crude, as Crude is more intricately linked to distillate compared to the highly refined end consumer product and definitely does not justify a move to a low of 96.79 from 98.0.
Hourly Chart
In fact, when we look at exact price action we can see that the decline in WTI prices already started a few hours before the announcement of DOE numbers. Hence, it is entirely possible that prices were already bearish to begin with, and bears simply used the less than stellar DOE numbers as an excuse to sell into. The fact that prices quickly rebounded is a testament to the notion that the bearish move was unjustified, and reflects a overzealousness reaction from bears.
So what is the reason why price moved lower to begin with?
Yesterday’s analysis showed that the rise in WTI was weak as 97.75 resistance wasn’t sufficiently tested even though the formula for a strong bullish push was there. Hence we already knew that the underlying sentiment in Crude isn’t strong. Hence, when price did manage to breach above 97.75 following stronger European risk appetite, it is no surprise that they were unable to sustain the gains and started to push down once again. The more important question now is whether underlying sentiment is still weakly bearish. If this is true then the likelihood of prices reversing lower becomes higher especially if risk appetite of either Europe and America turn south. Stochastic agrees with stoch curve already within Overbought region and favoring bearish scenarios moving forward.
Daily Chart
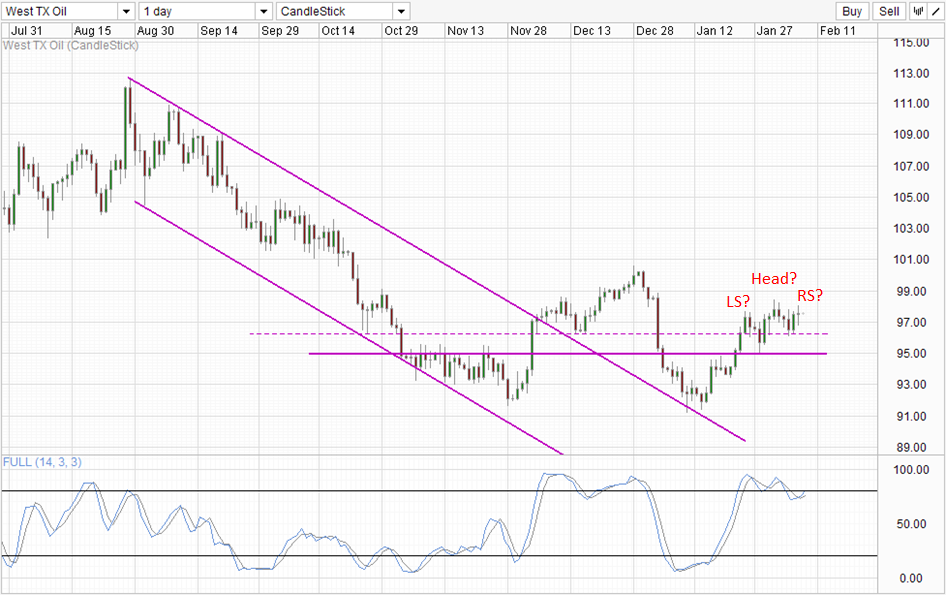
Daily Chart is bearish as the bullish move from mid Jan appears to have stalled. There is also a potential Head and Shoulders pattern in the making. However, we will definitely need stronger confirmation as Stochastic readings is threatening to invalidate the bearish cycle signal that was formed last week. The need for further confirmation becomes even higher when we take into consideration the lack of clarity in short-term price action. As such, conservative traders may wish to hold for clearer signs of bearish conviction e.g. a break of 96.25 and a stoch break of 72.0 which may lead us to 95.0 and potentially further bearish objectives if the Head and Shoulders pattern is formed.
More Links:
NZD/USD Technicals – Bullish Above 0.82 But S/T Direction Not Strong
AUD/USD – Maintains Breaks Through 0.89
EUR/USD – Runs into Resistance around 1.3550
This article is for general information purposes only. It is not investment advice or a solution to buy or sell securities. Opinions are the authors; not necessarily that of OANDA Corporation or any of its affiliates, subsidiaries, officers or directors. Leveraged trading is high risk and not suitable for all. You could lose all of your deposited funds.


