Price action for yesterday looks fairly similar to Wednesday – prices started pushing higher during Asian/European hours only to see US session sending prices much lower. Today seems to be a little bit different though, with prices getting on the backfoot during Asian session with the small downtrend likely to be extended during European hours despite a flurry of green seen on European Index Futures – suggesting that European stocks should be trading higher later today.
Hence, it is clear that Crude isn’t tracking risk appetite right now, so what is driving prices?
Hourly Chart
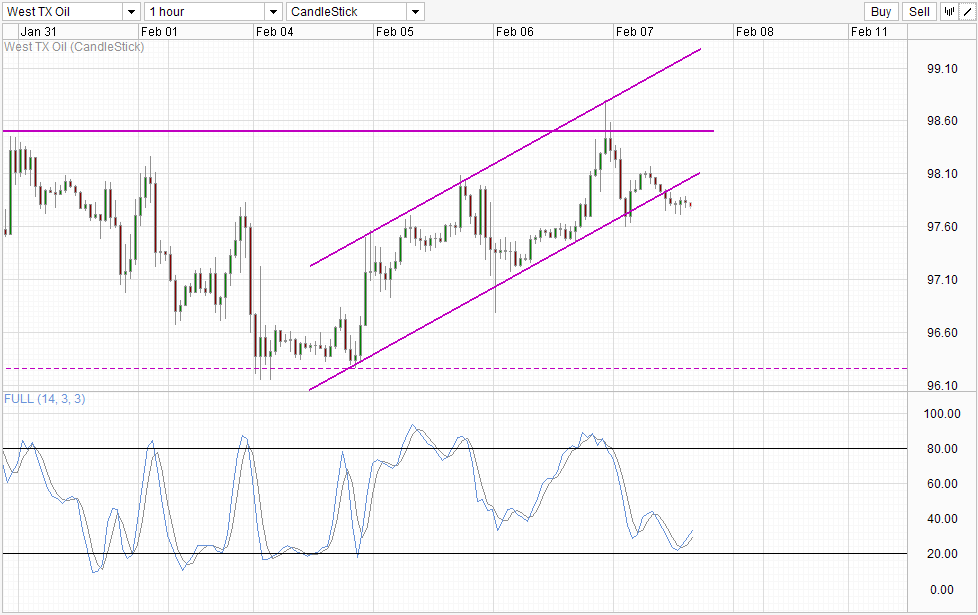
The obvious answer will be technicals, as price action for the past 2 days fits nicely within an rising channel. The fact that the biggest bouts of rallies and sell-off did not match with any fundamental news releases but instead matches nicely with the Channel boundaries affirms this notion that technical influences is much stronger currently. If this is true, then the latest bearish break from Channel Bottom should be be able to inspire further sell-off towards 97.6, 97.1 or even 96.25 support if the bearish breakout momentum is strong. However, looking at Stochastic levels, it is more likely that prices may find support by 97.10 as we are not very far from the Oversold territory.
Non-Farm Payroll later may help to affirm the Channel Breakout as well. A weaker than expected print is likely to drive Crude prices lower, accelerating the bearish breakout. Alternatively, a stronger than expected print will send prices higher on knee-jerk bullish reaction but as long as price stay below Channel Bottom, the breakout will still remain intact and further sell-off will still be possible. It is also plausible that price trades lower despite a stronger NFP print but that will only help us affirm the bearish breakout play. Only if prices start to push higher despite a weaker than expected NFP will we need to change the current bearish outlook, which makes it 3 out of 4 scenarios favoring/affirming downside movement.
Daily Chart
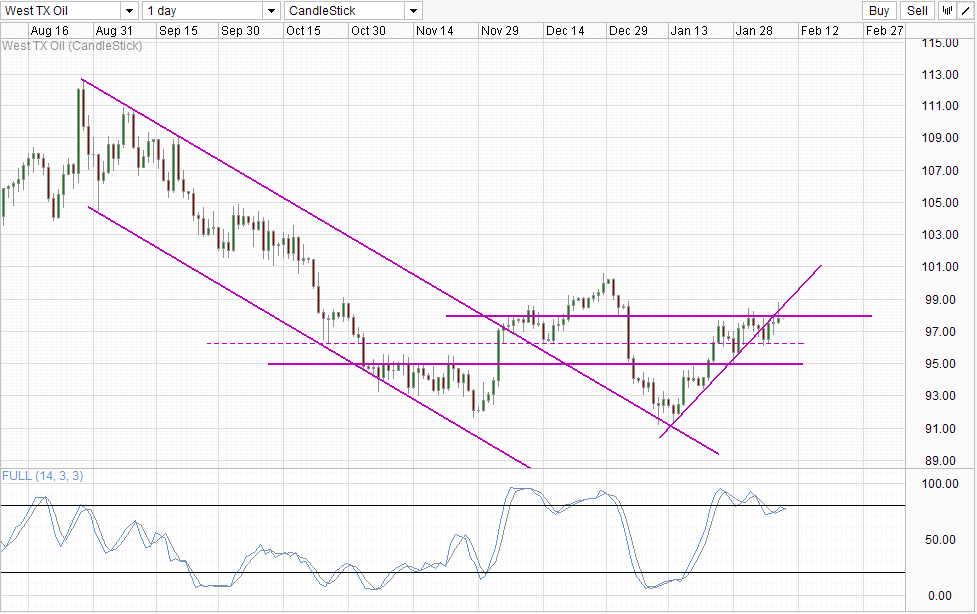
Daily Chart is less optimistic about bears though as yesterday’s rally has successfully snuffed out the possibility of a Head and Shoulders Pattern. Nonetheless, Price action is still bearish with a Shooting Star candle underneath the 98.0 resistance and confluence with rising trendline. Stochastic readings remains below 80.0, suggesting that the bearish cycle that started with last week’s bearish rejection off 98.0 is still a go ahead.
More Links:
NZD/USD Technicals – Back Within 0.82 – 0.825 After “Fakeout”
S&P 500 – 1,770 Key Resistance Reached After Strong Rally
Natural Gas – No More Cold Air To Blow Prices Higher
This article is for general information purposes only. It is not investment advice or a solution to buy or sell securities. Opinions are the authors; not necessarily that of OANDA Corporation or any of its affiliates, subsidiaries, officers or directors. Leveraged trading is high risk and not suitable for all. You could lose all of your deposited funds.

Mingze Wu
Latest posts by Mingze Wu (see all)
- European Bourses Not Enjoying Bullish Winds From US Stocks - 17 April 2014
- More Aggressive Stimulus Possible Despite Premier Li’s Denial - 17 April 2014
- China March FDI -1.5% Y/Y vs +2.05% expected. First decline in more than a year. - 16 April 2014