Crude Oil gain yesterday together with Stocks, as broad risk trends was surprisingly bullish during US session despite weaker than expected economic news released during the period. Seeing as how Gold prices continued to climb higher as well, we are forced to once again consider the possibility that market may be bullish due to stimulus speculation – where worse than expected economic numbers spurred Stock prices and risk correlated assets higher as market believe that the Fed would be forced to keep current taper pace on hold.
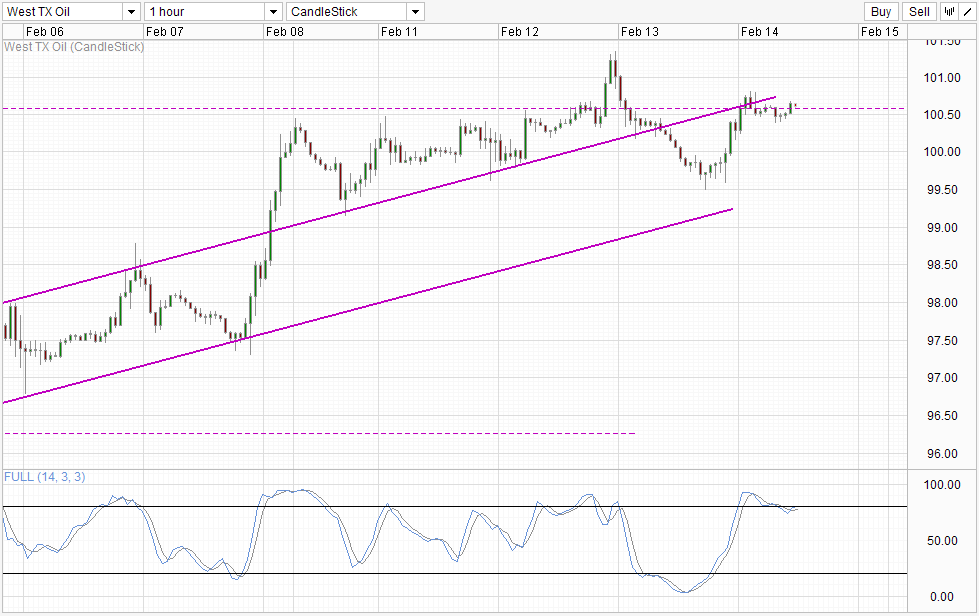
Hourly Chart
This however, is not really a solid fundamental reason for risk sentiment to be bullish as Fed Chairman Yellen has mentioned only on Tuesday that the pace of QE taper will continue unless the recovery prospect of US economy has shifted significantly. Hence there is a high likelihood of traders becoming disappointed in the next few FOMC monetary policy announcements, and the downside risk for risk correlated assets will be high moving forward.
The downside risk for WTI Crude is even greater, as technical bearish pressure remains despite yesterday’s rally. Prices remained below 100.57 resistance and below Channel Top, as such Channel Bottom remained a viable target without invalidating the bullish uptrend that is currently in play. Stochastic indicator agrees as well, with stoch curve giving us the beginnings of the bearish cycle signal. Stoch curve may have pushed up higher in the past few hours, but readings remain below 80.0, and the signal is not invalidated. Given that fundamental factors is weak, it is easy to imagine prices being nudged lower without much resistance.
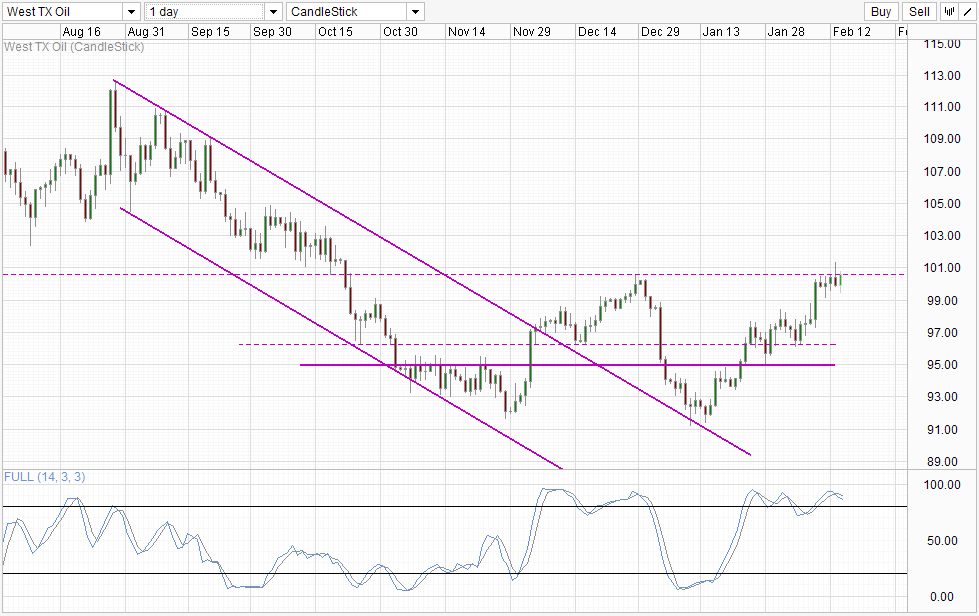
Daily Chart
Things are actually bullish on the Daily Chart though, as the bullish momentum from Jan lows remain firmly in play while the Shooting Star bearish reversal signal formed yesterday has failed (or seemed to have failed for now). Stochastic curve is pointing lower but we may have to ignore it for now as counter-trend Stochastic signals tend to be less reliable during strong trends – one which we are currently under considering that prices continue to climb even though there is no strong justification for higher prices.
Hence, given all the mixed signals between Short-Term and Long-Term price action analysis, and the fact that fundamentals are weak, traders may wish to stay clear, or at least wait for long-term and short-term price direction to line up. If one is comfortable with playing the bullish momentum even though there is little fundamental justification, we can seek confirmation of the bullish momentum should Short-Term price action find support on the Channel Bottom which opens up a potential move towards 100.57 for a third test. Alternatively, another sign of strong bullish momentum can be a clear break of 100.57 on the Daily Chart coupled with fresh bullish momentum on the Short-Term chart.
More Links:
AUD/USD – Despite Excursion, 0.90 Level Remains Key
EUR/USD – Looking to Challenge Resistance at 1.37 Again
GBP/USD – Moves to New Multi-Year High Above 1.6670
This article is for general information purposes only. It is not investment advice or a solution to buy or sell securities. Opinions are the authors; not necessarily that of OANDA Corporation or any of its affiliates, subsidiaries, officers or directors. Leveraged trading is high risk and not suitable for all. You could lose all of your deposited funds.


