It seems that WTI Crude did not receive the memo that yesterday was supposed to be bearish. Yellen’s surprising hawkish comments drove Stocks sharply lower and pushed Treasuries yield higher yesterday, USD was also strengthened due to safe-haven flow on top of higher rate expectation. All these should have driven risk correlated WTI Crude lower, but that did not happen and instead prices actually climbed higher. It is not as though Crude Oil was immune to the broad negativity, as Brent Crude was trading lower.
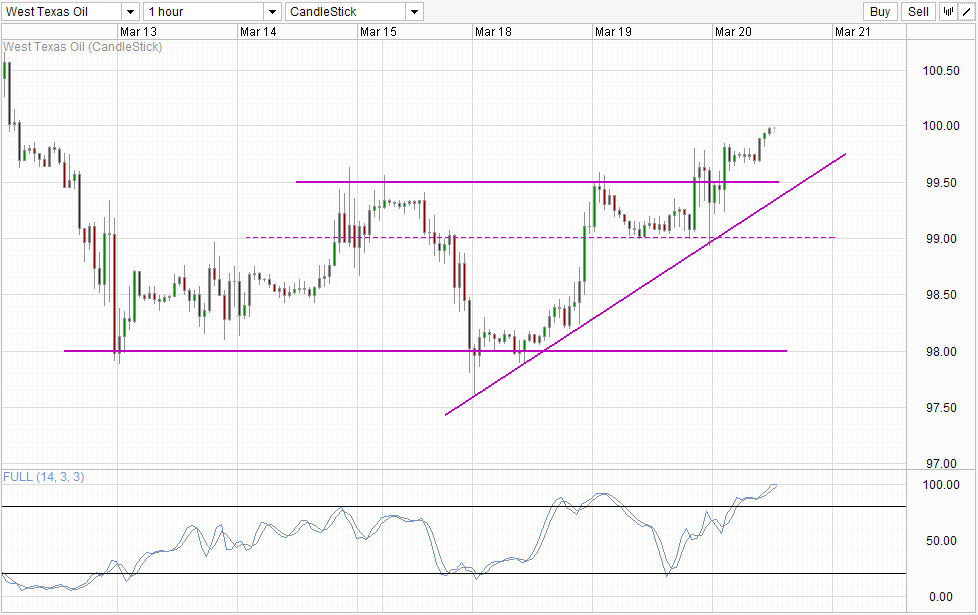
The mystery deepens when we consider that latest data from Department of Energy reflected a higher than expected inventory build up for the weak of 14th March. Crude Oil inventories grew by 5.85 million barrels when analysts were calling for a 2.75 million hike. This suggest that implied demand for Crude is much lower than expected and provided additional bearish pressure for Oil prices in US. Inventory in Cushing OK did decline by slightly under a million barrels, but that is much lower than the additional build up in overall inventory mentioned earlier, and should not have a net bullish impact. Case in point, it is clear that market actually reacted bearishly when the numbers were first given, hitting below 99.0 initially before rebounding up higher.
Hourly Chart
Hence, it is clear that prices rallied in spite of the DOE numbers, and not because of it. From a technical perspective, the failure to breach 99.0 and confluence and rising trendline suggest that initiative is firmly within the bulls’ court. By trading above 99.5 prices bulls have also successfully mount a bullish breakout and we could still see prices climbing higher and allow us to ignore the fact that Stochastic readings are at the highest Overbought levels in 2014.
That being said, 100.0 round figure remains a tough challenge for bulls, and considering that there is very little going on in terms of fundamentals or global risk appetite that can propel prices higher, do not be surprised if the round figure ultimately holds even though sentiment of WTI is extremely bullish right now.
Daily Chart
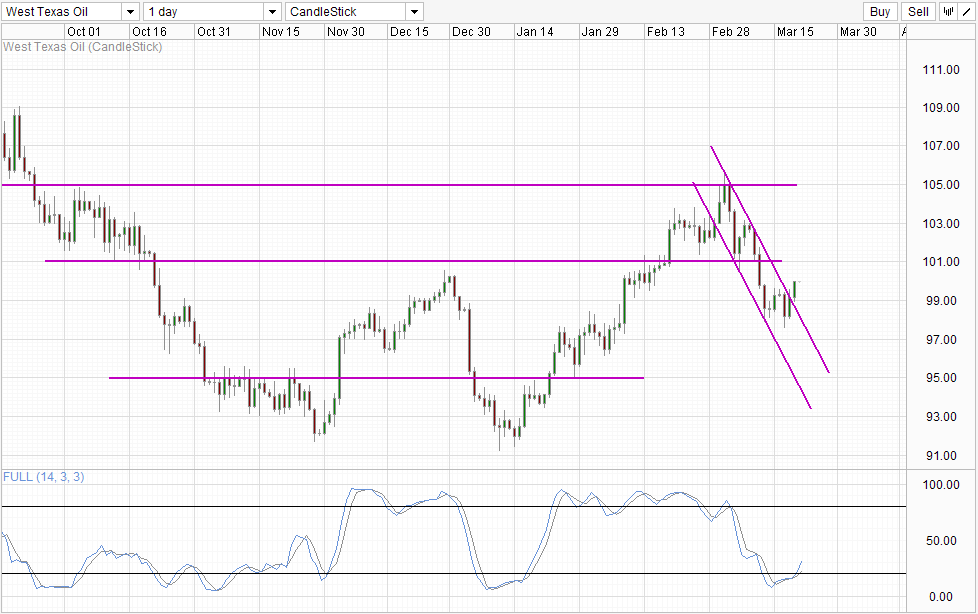
Things are more optimistic on the Daily Chart though. The breakout of the descending Channel coincides with a bullish cycle signal seen on WTI suggest that overall bullish uptrend since the beginning of Jan remains in play, and a push towards 101.0 significant resistance and potentially all the way to 105.0 and more is possible in the long run. The only problem is that we will need a shift in fundamentals to justify a long-term gain scenario for WTI. Right now there isn’t anything that suggest that this is even remotely possible. The Seaway pipeline expansion narrative is the only thing bullish event that is going for WTI right now, and it is unlikely that this development alone will be able to send prices all the way back to Feb levels.
More Links:
GBP/USD – Slight Gains As Employment Data Shines
AUD/USD – Steady As Markets Eye Fed Announcement
NZD/USD Technicals – Bulls Barely Live On After Wounded By Yellen’s Words
This article is for general information purposes only. It is not investment advice or a solution to buy or sell securities. Opinions are the authors; not necessarily that of OANDA Corporation or any of its affiliates, subsidiaries, officers or directors. Leveraged trading is high risk and not suitable for all. You could lose all of your deposited funds.


