Crude Oil ended up lower yesterday vs Friday’s close, but prices remain broadly supported when placed alongside US stocks where Nasdaq 100 has just seen the largest 3-day slide in 3 years while S&P 500 has completely erased daily gains. The decline in WTI compared to equities is definitely much milder, especially since Crude tended to be more volatile historically versus these indexes.
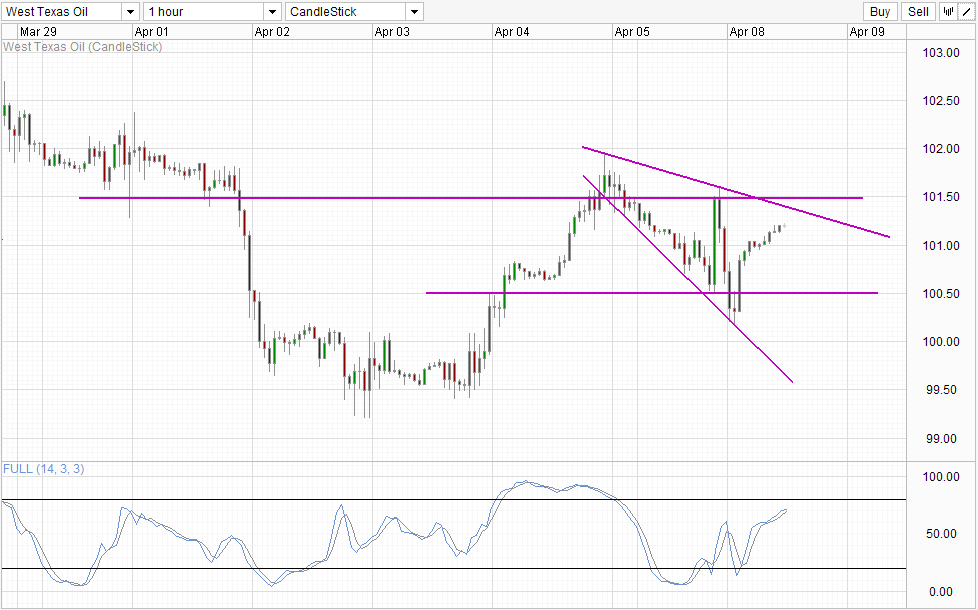
That being said, it is not surprising to see WTI prices staying more supported as we already suspected that bulls were more than capable to hold their own seeing as how pace of decline was relatively measured early yesterday despite strong bearish fundamental development (read: Libya). Hence, in our analysis yesterday we pointed out that prices will likely find support around 100.5, which played out to our expectations.
Hourly Chart
However, what is not expected is the strong bullish rebound that followed, sending price all the way up to 101.5 which is then accompanied by a quick push back towards 100.5 once again only to see prices punching back above 100.5 leaving us above 101.0 round figure right now.
In some sense this price action still fits into the price action scenario postulated yesterday, as overall S/T trend remains bias towards the downside from a technical perspective. Furthermore, long-term fundamentals favor lower WTI prices while broad risk trend is bearish as well, as such the likelihood of strong bullish follow-through was always unlikely and it is not surprising to see 101.5 holding firmly.
The key question is what next?
Well, the situation hasn’t really changed much from Monday. All the factors mentioned earlier remains the same, and as such it is likely that prices will hit top wedge resistance and push lower once more. Expect 100.5 to provide significant support once more too, which will open up upper wedge as a possible target again.
For those who are doubting the strength of 100.5 may be justified, as a support level that is tested repeatedly has a higher likelihood of breaking eventually. But traders may need to rethink this scenario as there are reports of Hedge Funds buying up Crude Oil yesterday on speculative bets. Hence, should prices drop down to 100.5 once more it is possible that these hedge funds may want to load up more positions again, providing the support needed in the short-term.
Daily Chart
Nothing much to be said from the Daily Chart though, as current price levels remain fairly similar to yesterday’s levels. As such, the same analysis applies – trend can be interpreted as either bullish or bearish depending on whether you are taking the perspective from Jan’s low or Mar high respectively. Given the ambiguity, traders should seek strong confirmations before committing, and considering that prices can indeed be highly volatile as seen from yesterday’s price action, it pays to be more careful as the chances of fakeouts and whipsaws are high.
More Links:
S&P 500 – Strong Bearish Momentum Developing
GBP/USD – Pound Moves Higher In Subdued Trading
USD/CAD – Steady After Strong Canadian Employment Data
This article is for general information purposes only. It is not investment advice or a solution to buy or sell securities. Opinions are the authors; not necessarily that of OANDA Corporation or any of its affiliates, subsidiaries, officers or directors. Leveraged trading is high risk and not suitable for all. You could lose all of your deposited funds.


