The U.K. election looks to be the closest fought in decades as the Labour Party tries to wrestle back power from a Conservative-led coalition government that has struggled to win over the electorate despite being in power for five years. The Conservative-Liberal Democrat coalition government has implemented a program of austerity and reforms aimed at deficit reduction, reducing the size of the public sector, and incentivising private sector job creation and growth.
From this perspective, its efforts have been rewarded. The deficit has fallen from more than 10% of gross domestic product in 2010 to 5% today, 2.3 million private sector jobs have been created, easily dwarfing the 500,000 lost in the public sector. Moreover, the U.K. can bask in the glow of being the fastest-growing developed economy in 2014.
However, the reputation of the Conservatives of being ruthless and uncompassionate while favouring the wealthy has grown during that time as real incomes fell, benefits were cut, and the upper rate of tax reduced from 50% to 45%. Inequality has been a key issue throughout the last few years on the British Isles as the gap between the rich and the poor has widened.
That said, the coalition government can claim that the top 1% now contribute almost a third of all income taxes, much more than under the previous government, while the lowest earners now pay less as a result of the lower tax threshold being lifted.
Controversial policy decisions such as the so-called “bedroom tax” and an increase in tuition fees — not to mention the number of people now on insecure zero-hours contracts – isn’t helping the Conservatives win any popularity contests. And though Prime Minister David Cameron’s pledge to hold a referendum on European Union membership by the end of 2017 if his government is re-elected has stirred positive sentiment among voters, it has also created a lot of uncertainty among many businesses that conduct a significant amount of trade as a result of the country’s E.U. membership.
The result of all of this is that despite the economy performing strongly, and unemployment being low at 5.6% while the number of those employed being at a record high, the Conservatives may not even win the election, much less secure an overall majority.
What Is the Election’s Likely Outcome?
The polls throughout the election campaign have barely changed, with the Conservatives and Labour occupying about a third of the vote each, and the remaining parties the final third.
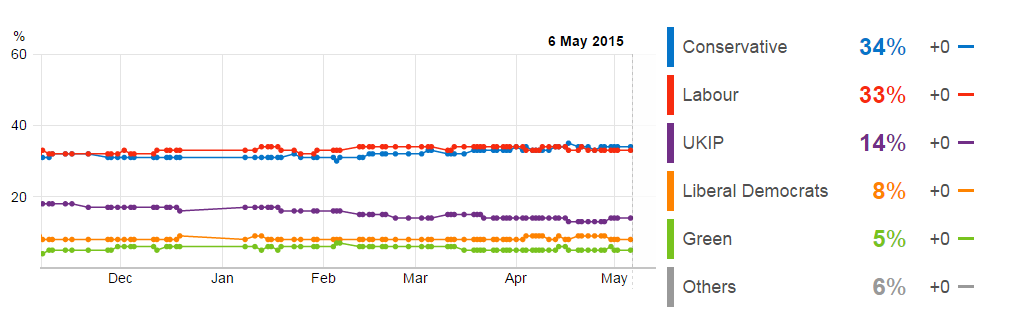
*This was taken from the BBC poll tracker.
This means no party is likely to get enough of the votes to rule by majority, resulting in a hung parliament. That will leave three possible options on the table: another coalition government, a confidence and supply agreement between two or more parties, or a minority government.
A coalition would probably offer the most stable government, although Labour Party Leader Ed Miliband has explicitly stated that he would not go into coalition with any rival as it would mean giving up parts of the Labour manifesto. The chances are this is just a ploy to win back some votes in Scotland from the Scottish National Party (SNP) as people vote tactically to prevent another Conservative-led coalition.
The latest polls suggest that the Conservatives will win the most seats but will struggle to form a majority government, although a Conservative, U.K. Independence Party, and Lib-Dem coalition could be enough to form a majority. If the Conservatives feel desperate enough to prevent Labour from returning to power, they may be forced to consider this.
The consensus view is that the “anti-Conservative” feeling is so great in Westminster, that a Labour minority government led by Miliband as prime minister is most likely. A minority rule would prove extremely challenging over the five-year term, and under these circumstances, we might see a change of heart from Miliband and a confidence and supply agreement with the SNP.
What About the Market’s Reaction?
So far, the market reaction has been fairly muted. The pound has been weak against the U.S. dollar since the middle of last year, but in that same time, it has performed well against a basket of currencies overall.
This, along with the rallying dollar, suggests that weakness in cable is not being driven by election uncertainty. If we need any more evidence of this, just compare the yield spread between the then U.S. 10-year Treasury and the U.K. 10-year gilt with cable over the last nine months. This shows that changes in interest rate expectations is what’s driving cable, not the election.
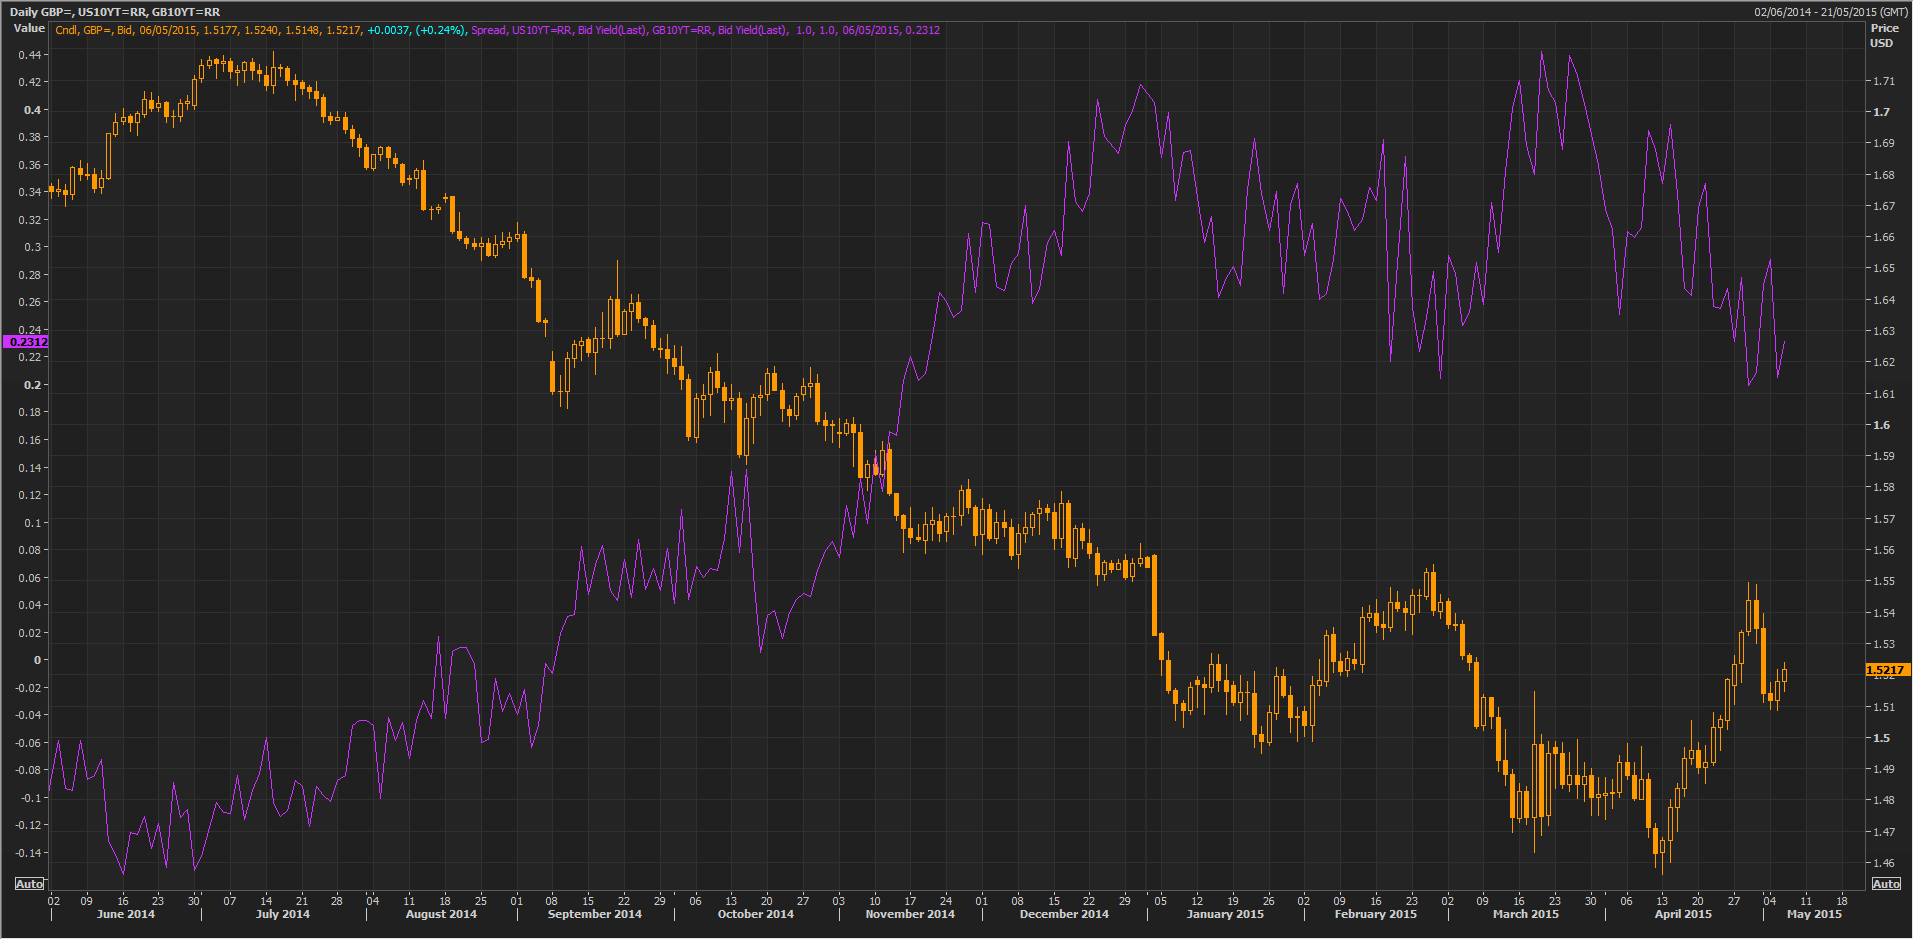
*This chart comes from the Reuters Eikon terminal.
That doesn’t mean we won’t see election uncertainty weighing on the pound in the final days, however.
Once the election results are out, expect to see more of a reaction because the result will have a direct impact on the economic outlook, and therefore, interest rates. For example, a Conservative majority or Conservative-led coalition is seen as being good for the economy as it will mean a continuation of the strong recovery that has prompted talk of interest rate hikes from the Bank of England. Conceivably, that should be sterling-positive.
The Labour Party, on the other hand, is seen as being less business-friendly and would bring higher taxes on the wealthy, more spending, thus potentially higher interest rates. This scenario is seen as being negative for the economy and investment, and it could weigh on growth this year, push back interest rate expectations, and weigh on the pound.
As you can see from the chart below, the correlation between the FTSE and the 10-year gilt yield isn’t very strong. This is because despite being a U.K. index and benefiting from low interest rates, it is made up of large multinational companies with a lot more exposure to other countries like China. It is unlikely to be impacted much by the uncertainty ahead of the election or its outcome.
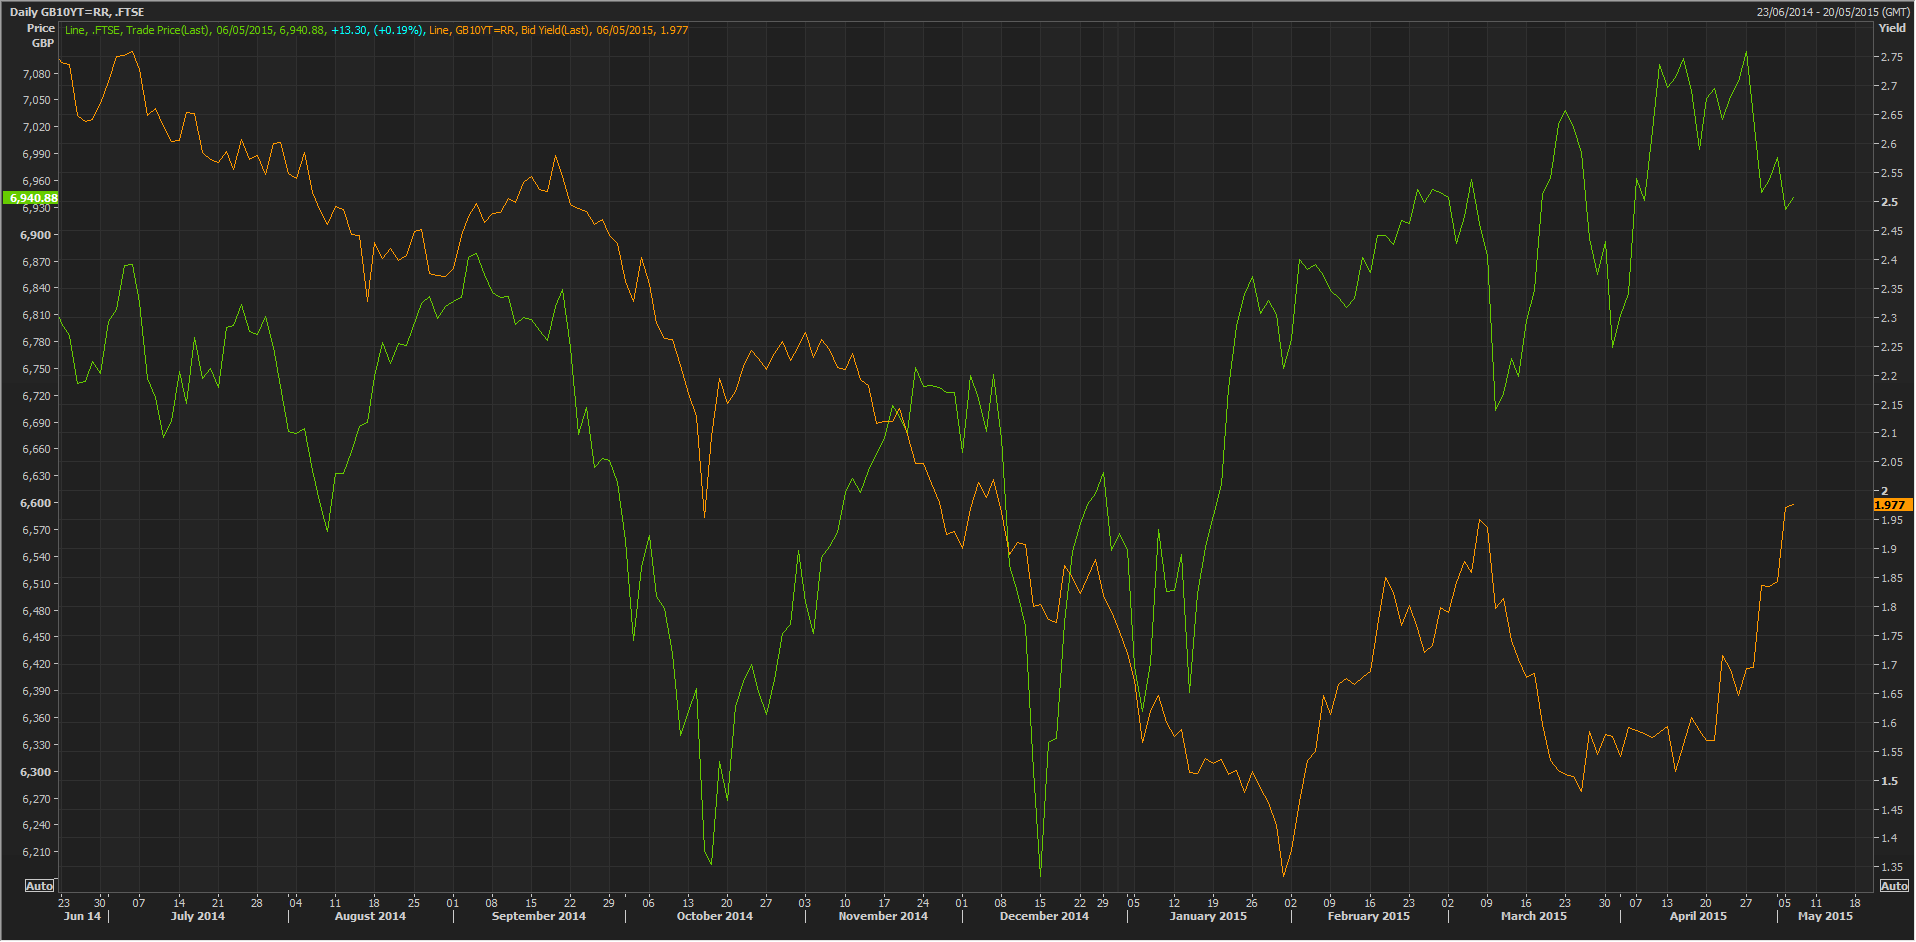
*This chart comes from the Reuters Eikon terminal.
What Do the Charts Tell Us?
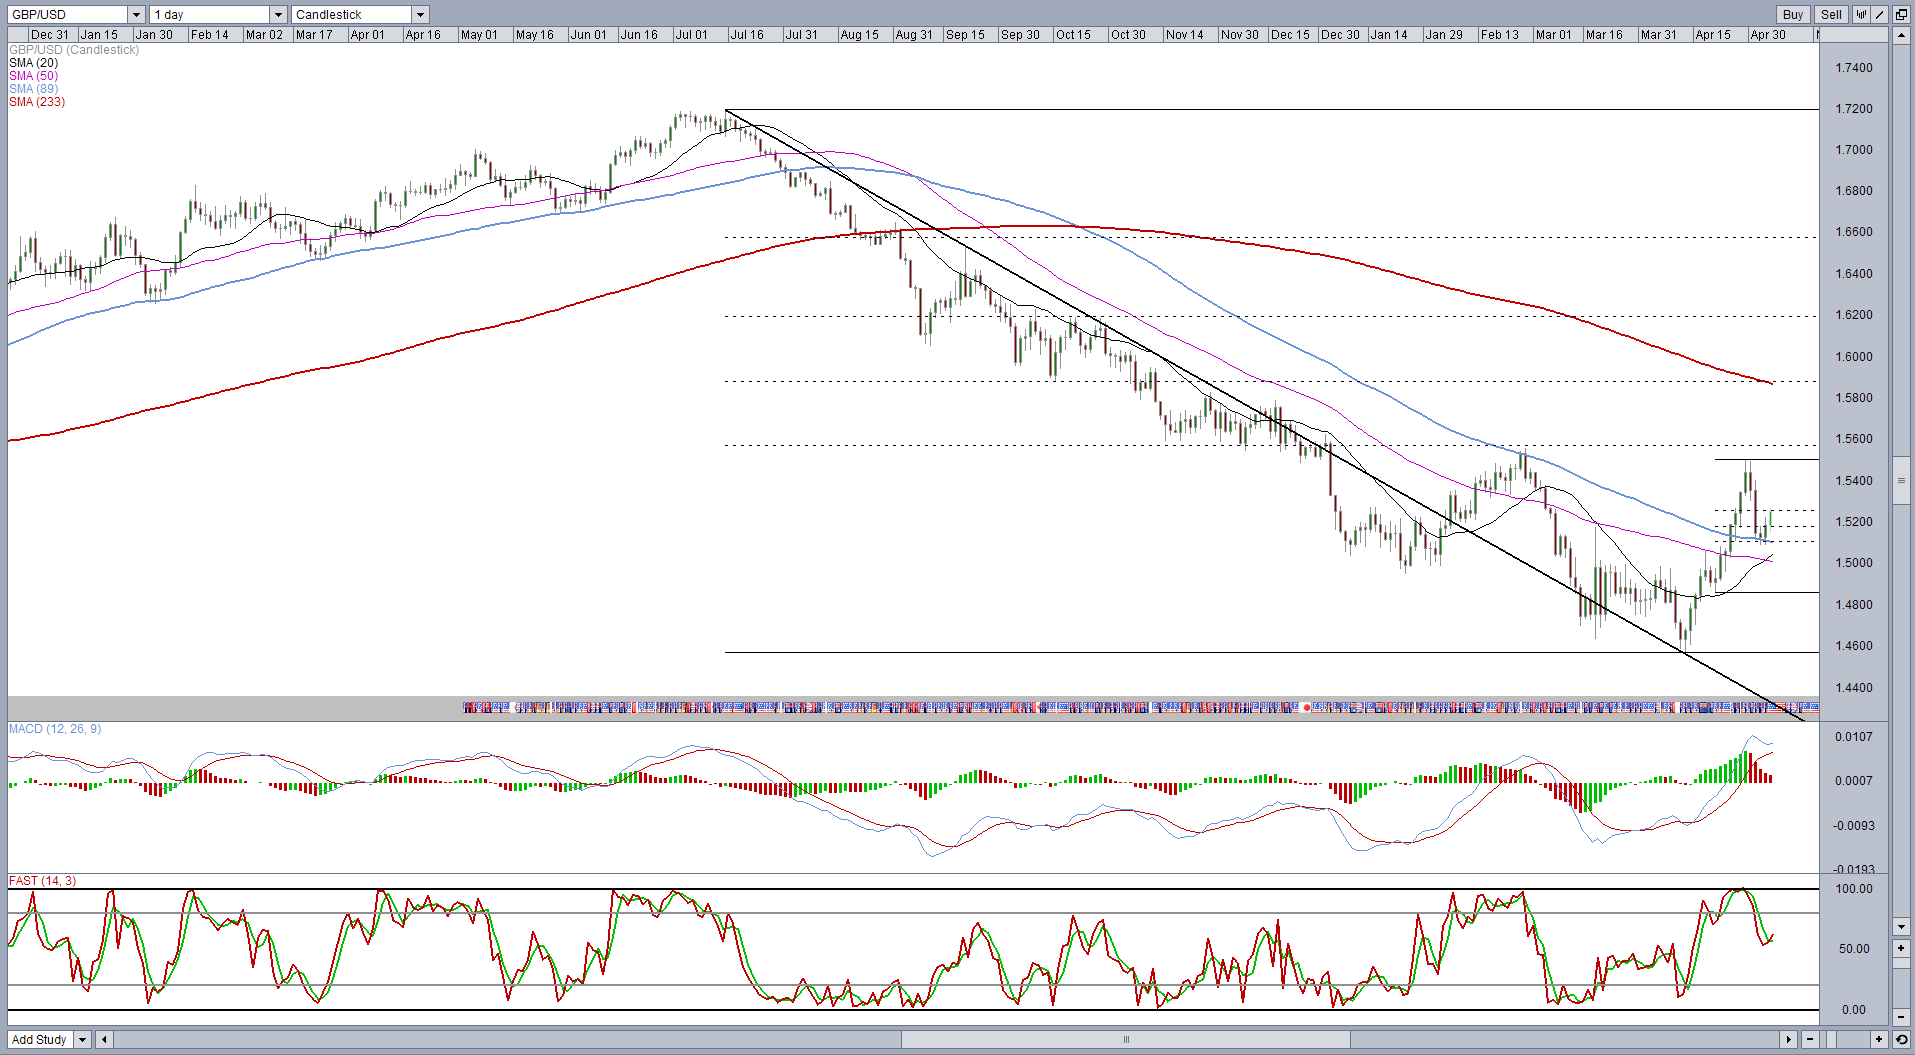
GBP/USD
The cable chart is looking quite bullish right now, having rallied strongly over the last month. The pair broke above the 89-day simple moving average and has since provided support on the pullback which is a very bullish signal. The 89-DMA is not an overly common moving average to use, but it is a Fibonacci number and has been a reliable support and resistance level in the past.
With the pair looking bullish, the next obvious resistance is April 29 highs around 1.55. If this can be broken, 1.5550 – 1.5570 comes into play as this area marks February 26 highs, November 14 to December 21 support, and 38.2% Fibonacci retracement level –July 15, 2014 highs to April 13, 2015 lows.
While this may mark the end of the correction and continuation of dollar strength, it could see it move further toward 1.5875. This is the October 15 low and the 50% retracement of the above move. The 233-DMA (another Fibonacci number that has proven reliable on this chart) could also act to cap a further upside move.

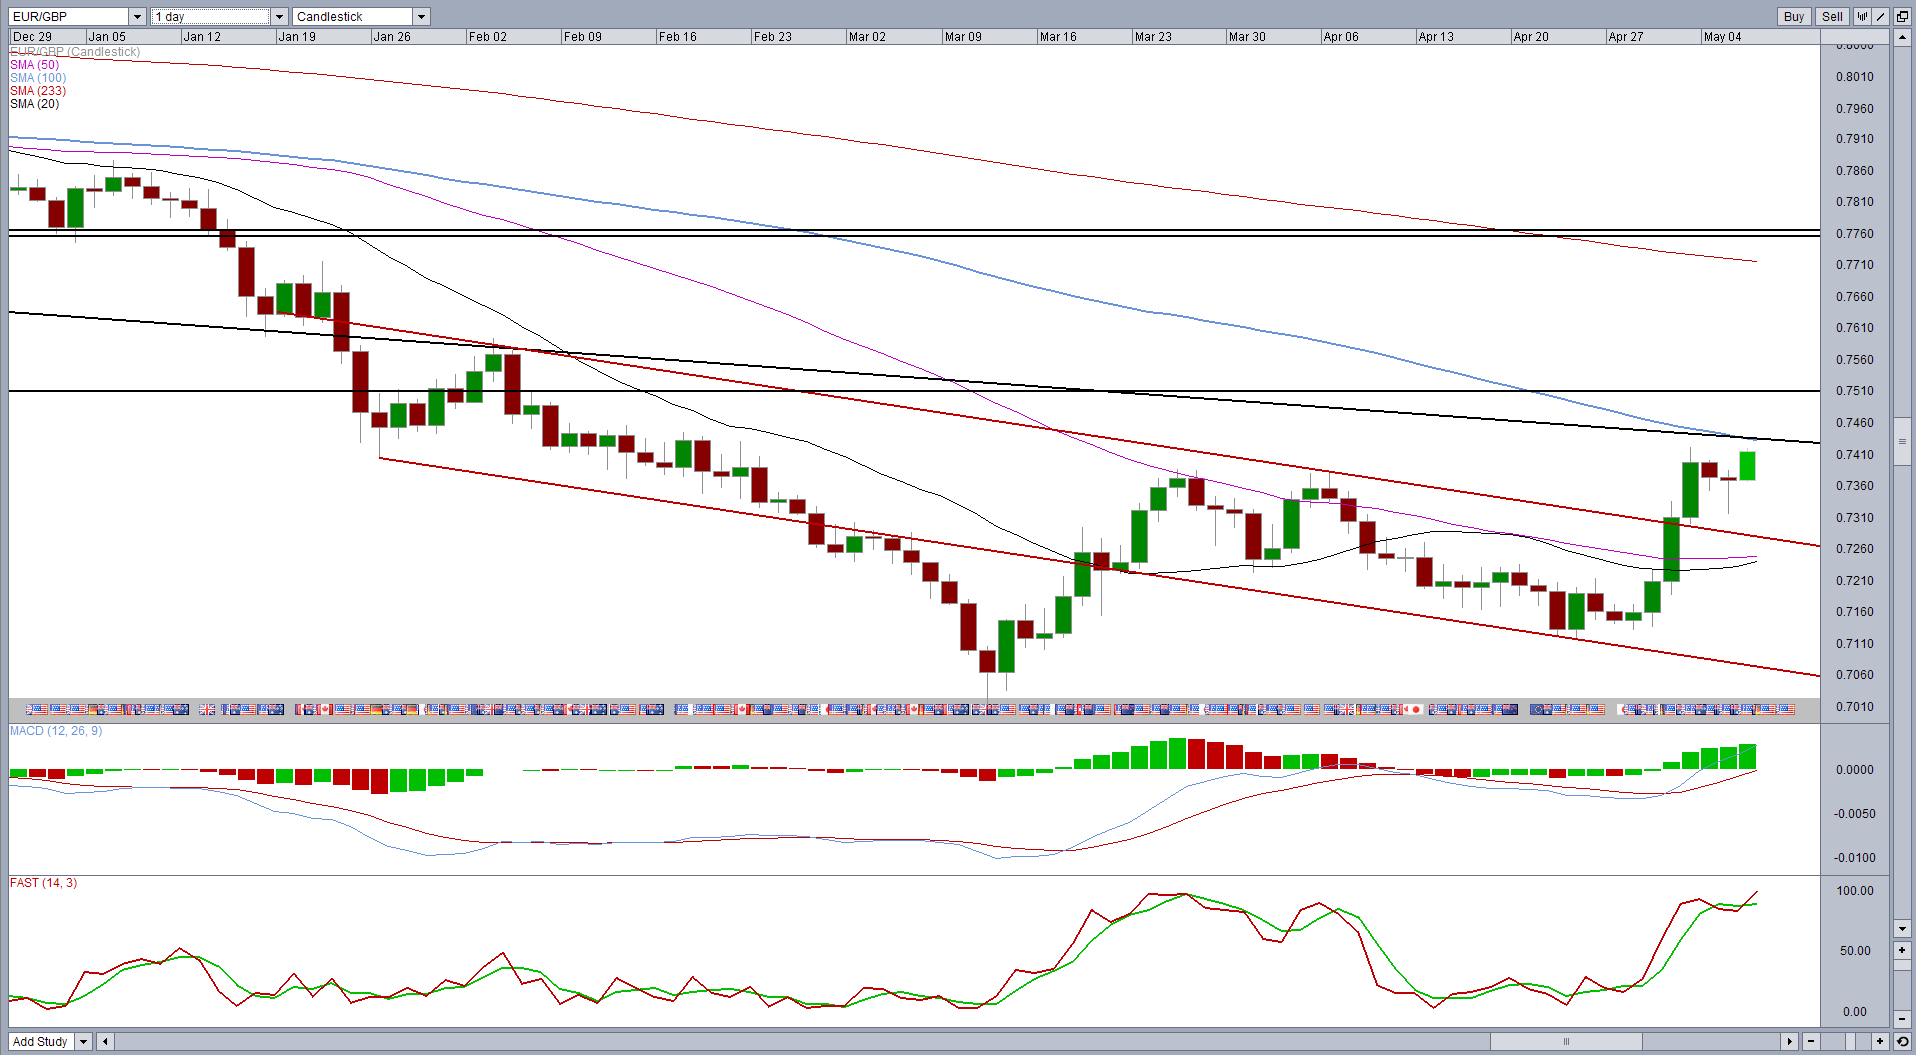
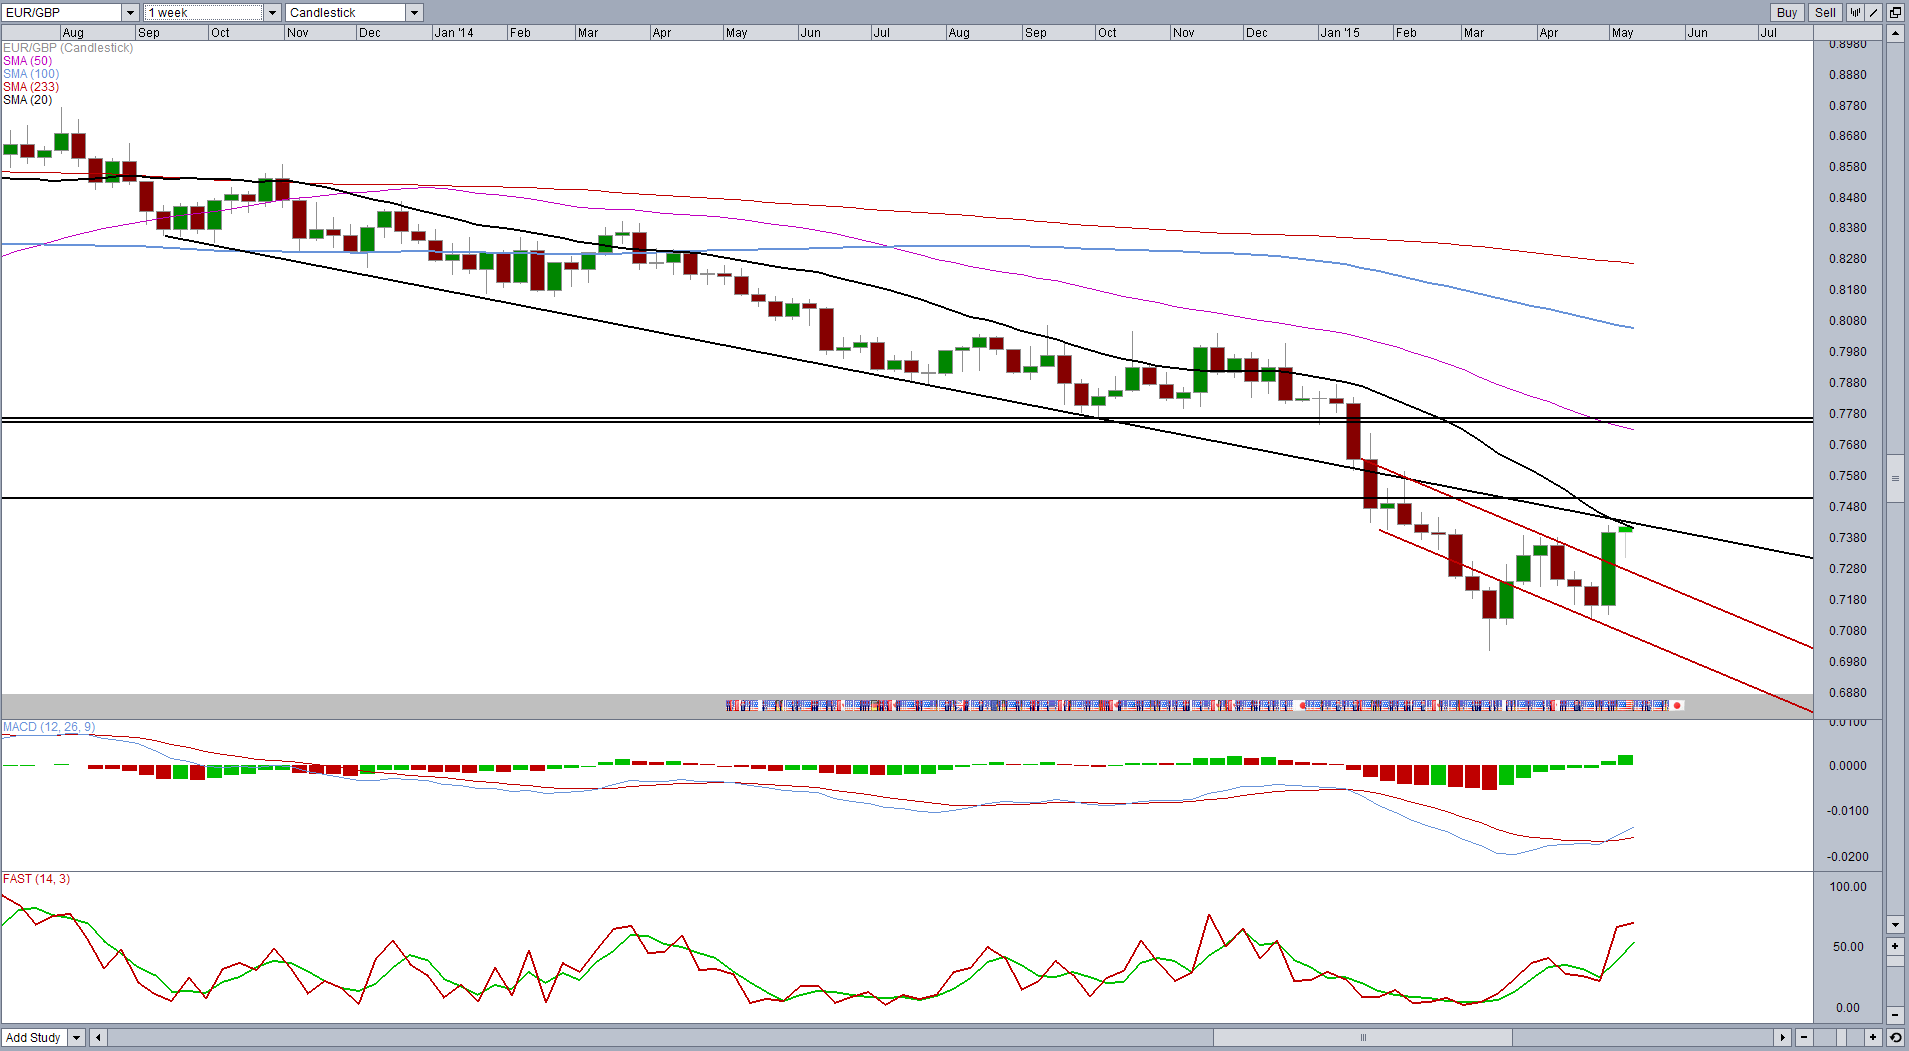
EUR/GBP
The pair is facing heavy resistance following a strong rally over the last week or so. The descending trend line which had previously offered support prior to the pair breaking below on January 22 is now providing strong resistance. Combined with the 20-week SMA and the 100-day SMA, this may prove a tough level to break. It is worth pointing out that while these have provided support and resistance on numerous occasions, they haven’t been reliable as of late.
There are no guarantees this level will hold, especially since the pair recently broke above the neckline of an inverse head and shoulders that formed between the middle of January and the end of April. A break of this kind offers two potential price projections, taking the size of the shoulder and the head and projecting them above the breakout point. This gives us two levels, around 0.75 and 0.7750, the latter of which acted as support between October and the end of the year.
If the current resistance level holds, it could lead to the formation of a double top with the neckline being yesterday’s lows. A break of this would be a strong bearish signal offering a possible price projection, based on the size of the formation, of around 0.7215.
Content is for general information purposes only. It is not investment advice or a solution to buy or sell securities. Opinions are the authors; not necessarily that of OANDA Business Information & Services, Inc. or any of its affiliates, subsidiaries, officers or directors. If you would like to reproduce or redistribute any of the content found on MarketPulse, an award winning forex, commodities and global indices analysis and news site service produced by OANDA Business Information & Services, Inc., please access the RSS feed or contact us at info@marketpulse.com. Visit https://www.marketpulse.com/ to find out more about the beat of the global markets. © 2023 OANDA Business Information & Services Inc.

Former Craig
Latest posts by Former Craig (see all)
- Market Insights Podcast – US GDP, RBNZ holds, bitcoin soars - 28 February 2024
- Market Insights Podcast – Nvidia earnings, record highs for stocks - 23 February 2024
- EUR/USD – A bullish breakout or just further consolidation? - 22 February 2024