Natural Gas has been bumping along the bottom of its long-term range for most of 2016. Indeed in March of this year, Natural Gas hit record lows of around $1.6 MMBTU’s.(that’s 1.6 million British Thermal Units to us humans. We’ll use BTU’s going forward.) The main reasons were twofold, record high inventories still in storage after the drawdown winter season and the general sell-off in risk that was occurring in markets at the time.
Since then natural gas has climbed steadily throughout the year even as inventories are ramped up again for winter. The chart below shows the daily prices. From a technical perspective, we appear to be marking time before a break higher. Natural Gas is testing a year-long resistance zone between $2.944 and $2.964 BTU’s (denoted by the red and the green lines), with a break opening a move to the $3.1000 initially and then the $3.350 BTU region.
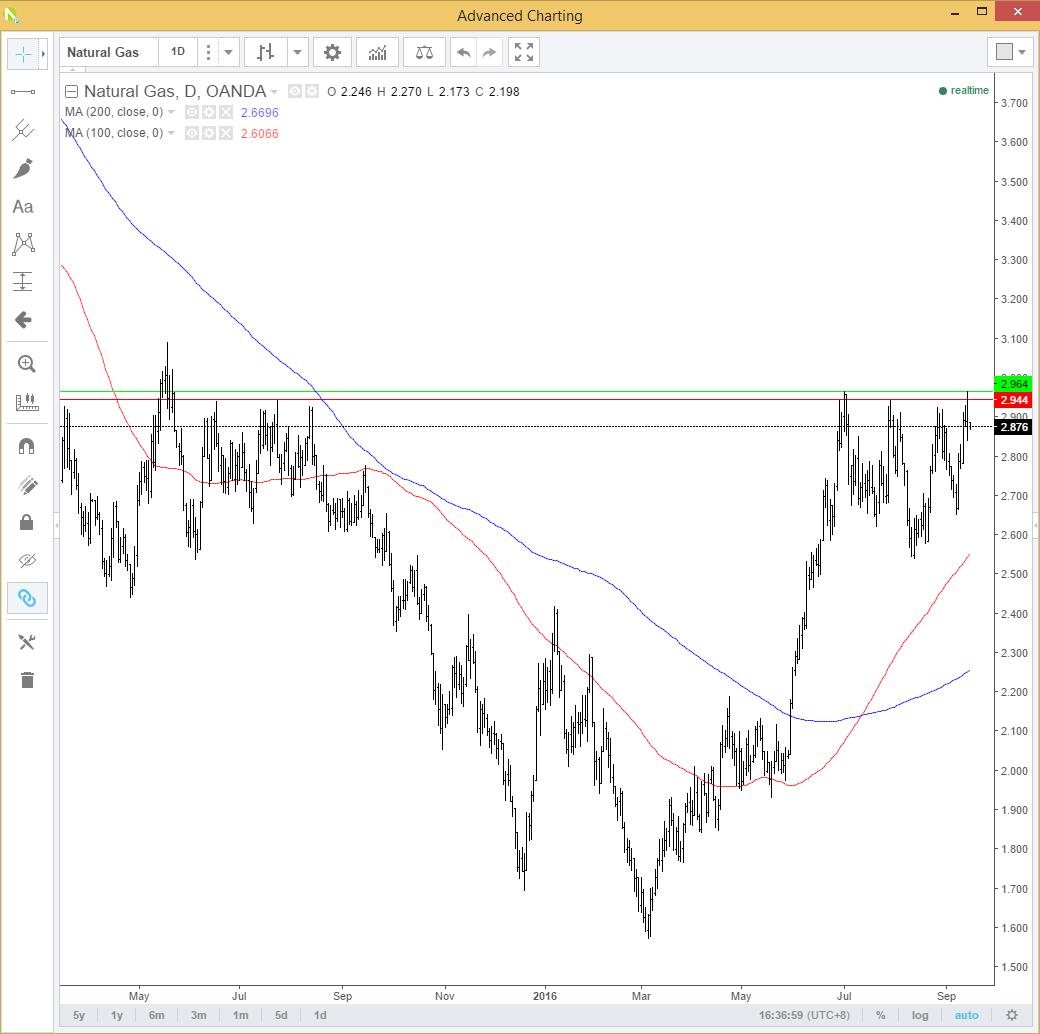
It is important to note though that this is very substantial resistance before everyone hits the buy button on their computers. Additionally, there are other dynamics at work outside the pure world of charting. For example, the main reason for the 3.5% rally in gas sine the lows of March has been El Nino driven warm weather driving up the use of air conditioning. Living in Singapore I empathise, I don’t know what we would do without air conditioning here! America’s need to stay cool has required power generators to generate more electricity meaning they have has to buy a lot more gas than expected.
The world hasn’t suddenly fallen in love with natural gas; it is simply that at record lows, it is cheaper to use by power generators than coal or oil. Another thing to note is that natural gas in America is almost entirely and proudly made in America, to paraphrase Donald Trump. Thus, from both the supply and demand side of the equation, it is a closed ecosystem so to speak.
Factors influencing natural gas prices could be listed as,
1. Domestic Supply (i.e., how much has been produced and is in storage)
2. Weather Disruption, e.g., hurricanes. More on this later.
3. Strength of the economy
4. Winter Weather.
5. Summer Weather. America uses more air conditioning.
6. Natural Gas held in storage.
7. Competition with other fuels. i.e., can large-scale users use cheaper alternatives?
Source EIA. Get the full list here. EIA
Looking at data from the EIA Short-Term Energy Outlook Report we see that regarding gas stored ahead of winter volumes are increasing in anticipation of the growth in demand on the 2nd chart through the winter months.
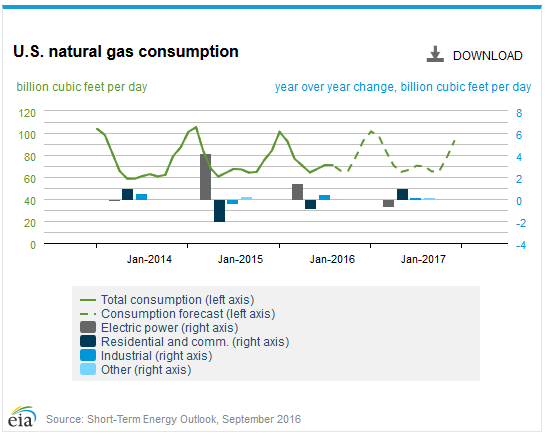
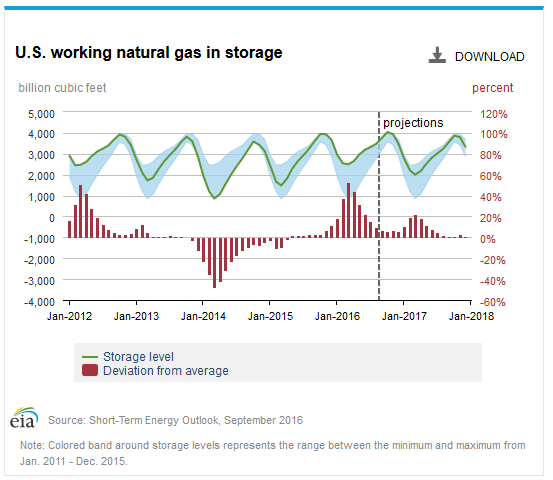
Source EIA Short-Term Energy Outlook
This brings us to La Niña. La Niña is in effect El Niño’s little sister. Occurring after the former and bringing the opposite effects weather wise. I won’t go into a lot of detail, needless to say, it tends to make Northern USA winters a lot colder and also increase hurricane activity substantially. (the hurricane season runs from June to November by the way)
Most importantly, going back to points 2 above, it, therefore, can disrupt production via increased cold temperatures in producing areas, hurricanes in others or interfere with the distribution network. It goes without saying that much colder winters in the Northern USA will mean extra more power and heating requirements. One or any or all of the combinations can put upward pressure on gas prices.
Interestingly 5 of the last 7 hurricanes causing over $USD 1 Billion in damages in the USA came in 2008 and 2011. La Nina years. (Source: CNN) However, La Nina does not occur in the same strength each Nino/Nina cycle. The chances of a strong La Nina were 75% in June and have dropped steadily since. Last night the US Climate Prediction Centre announced they had ceased the La Nina watch for this year as their predicted odds of it occurring had dropped to 40% .
This will no doubt disappoint those bullish on gas and be eyeing a break of the technical level noted above. A milder winter with fewer hurricanes most likely places you in a minority, though! Meteorology is an inexact science, though. And the model still suggests a 40% probability.
Summary
Natural Gas has recovered from the record lows in March with a steady 3.5% climb in prices since. We are now abutting a strong technical resistance region at 2.944/2.964 BTU’s with a break implying higher levels. However, other climatic factors induced by La Nina may or may not play their part. A drop in La Nina expectations will make this technical level hard to break for now. But climatic complacency has the potential to prove the doubters wrong. Traders should monitor La Nina developments carefully in case the meteorologists have got it wrong!
Content is for general information purposes only. It is not investment advice or a solution to buy or sell securities. Opinions are the authors; not necessarily that of OANDA Business Information & Services, Inc. or any of its affiliates, subsidiaries, officers or directors. If you would like to reproduce or redistribute any of the content found on MarketPulse, an award winning forex, commodities and global indices analysis and news site service produced by OANDA Business Information & Services, Inc., please access the RSS feed or contact us at info@marketpulse.com. Visit https://www.marketpulse.com/ to find out more about the beat of the global markets. © 2023 OANDA Business Information & Services Inc.
Jeffrey Halley
Latest posts by Jeffrey Halley (see all)
- Oil slides, gold rally continues - 5 August 2022
- US dollar retreat continues - 5 August 2022
- Pelosi relief rally in Asia - 5 August 2022