While the world’s attention has been on the drop in Gold this week, we shouldn’t forget the fireworks amongst its little brothers and sisters.
All eyes will be on the Non-Farm Payrolls tonight with a print at 200,000 or better ticking the final rate hike box for the Fed at next week’s FOMC. Gold, as we know, has suffered this week as its appeal diminishes as an asset with U.S. yields rising and the fading of the safe-haven call underpinning it. The world I suspect has yet to price in what may be a series of Fed rate hikes this year with the U.S. economy firing on all cylinders it seems.
Gold itself is down over 3% for the week, but the action hasn’t been confined to just it in the precious metal universe. Platinum and Palladium have also suffered to the same extent, and for Silver, it is a whopping six-plus percent correction. Silver tends to overshoot Gold moves as a function of liquidity or lack there-off. The exit door always being smaller then Golds.
A quick glance at the charts though shows all four of the precious metals groups have broken some interesting downside levels.
GOLD
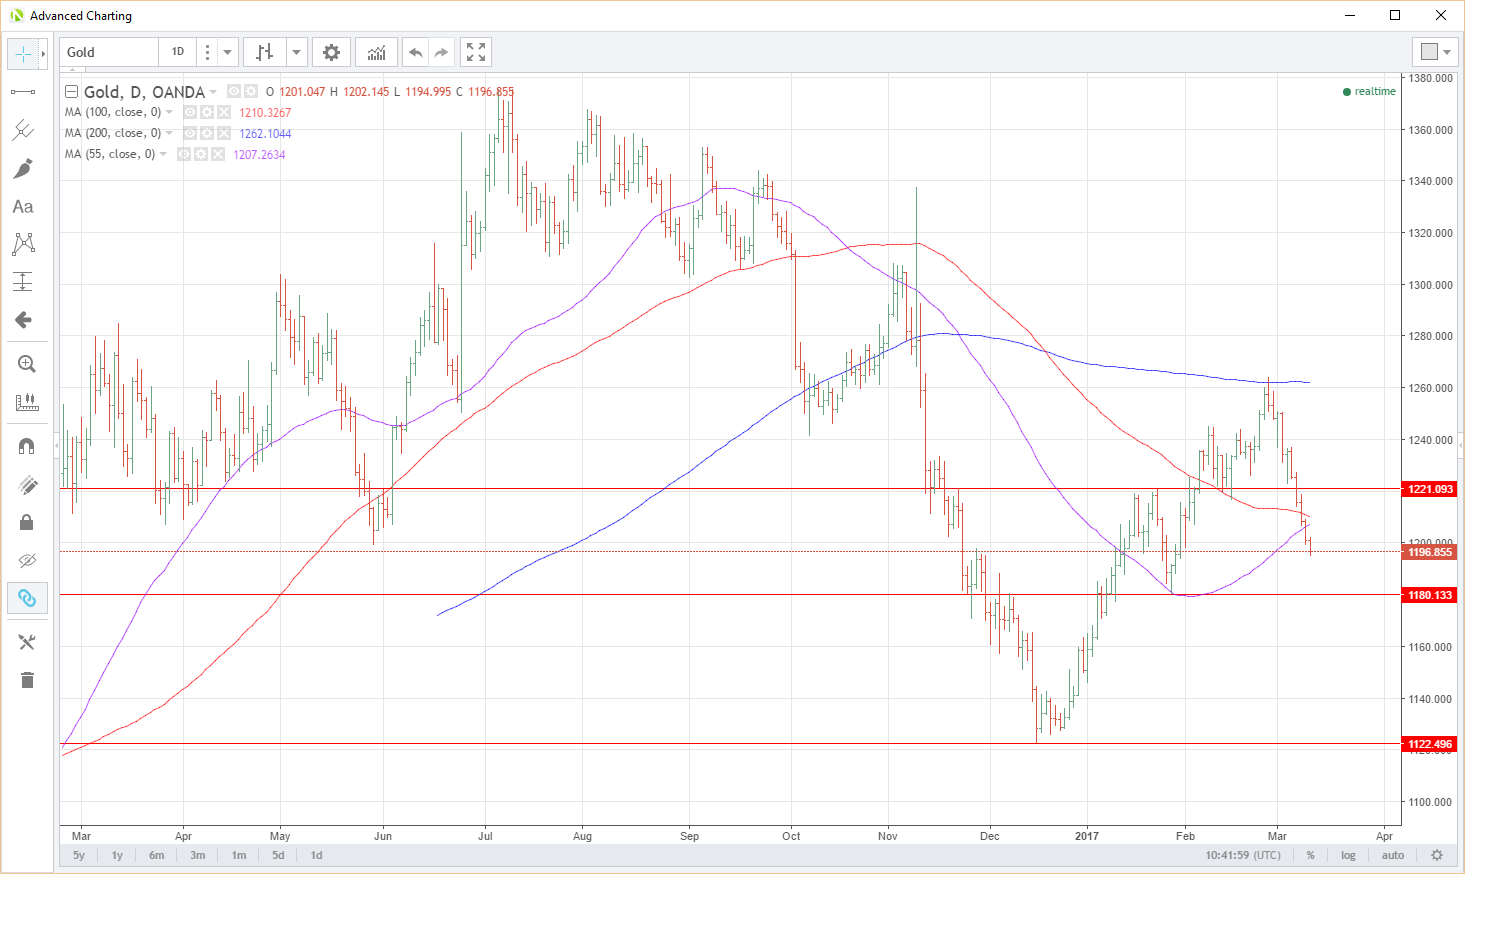
It’s hard to believe that 1262 the 200-day moving average (DMA) was only tested and failed at 11 days ago. In the last two days, Gold has also broken it’s 55 and 100 DMA’s as well at 1210.30 and 1207.25 which now become resistance.
Gold is trading below 1200 at 1197 as we speak with the last clear support on the daily chart at the 1180 level, the January low. A close below here sees a lot of clear air to these wizened eyes, and a break could open a move to the distant 1122.50 level.
SILVER
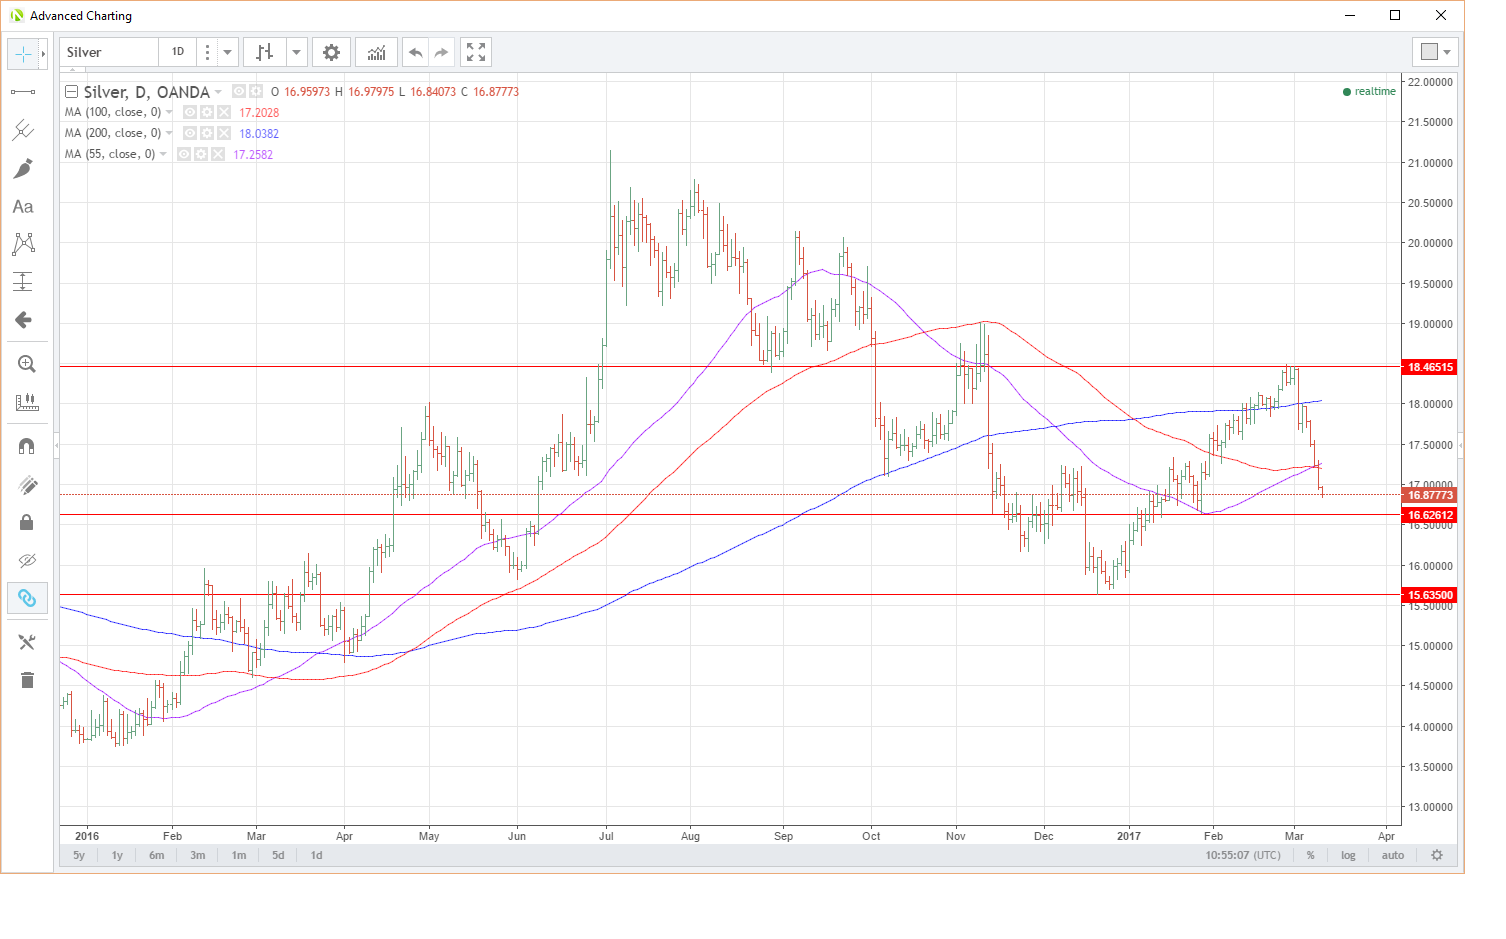
Down over six percent for the week, there has been no silver bullet for Silver bulls unless it was one to the heart. Silver failed numerous times at the 18.4500/18.5000 region before an ugly descent through the 200-dma at 18.0400.
Silver has since broken the 55 and 100-dma’s as well at 17.2600 and 17.2000 respectively, and these become first resistance.
Like Gold, it has one major support level just below at the 16.6300 area before a hole opens up on the charts to 15.6350.
Palladium
To be fair to Palladium, it has had a stellar year amongst the precious metals group. Palladium at one stage was up 42% from its 2016 lows! Thus in the scale of things, it’s pullback is a mere flesh wound. Part of this maybe that Palladium is also a heavily used industrial metal and has benefited from the rise in hard commodities in general over the last 12 months.
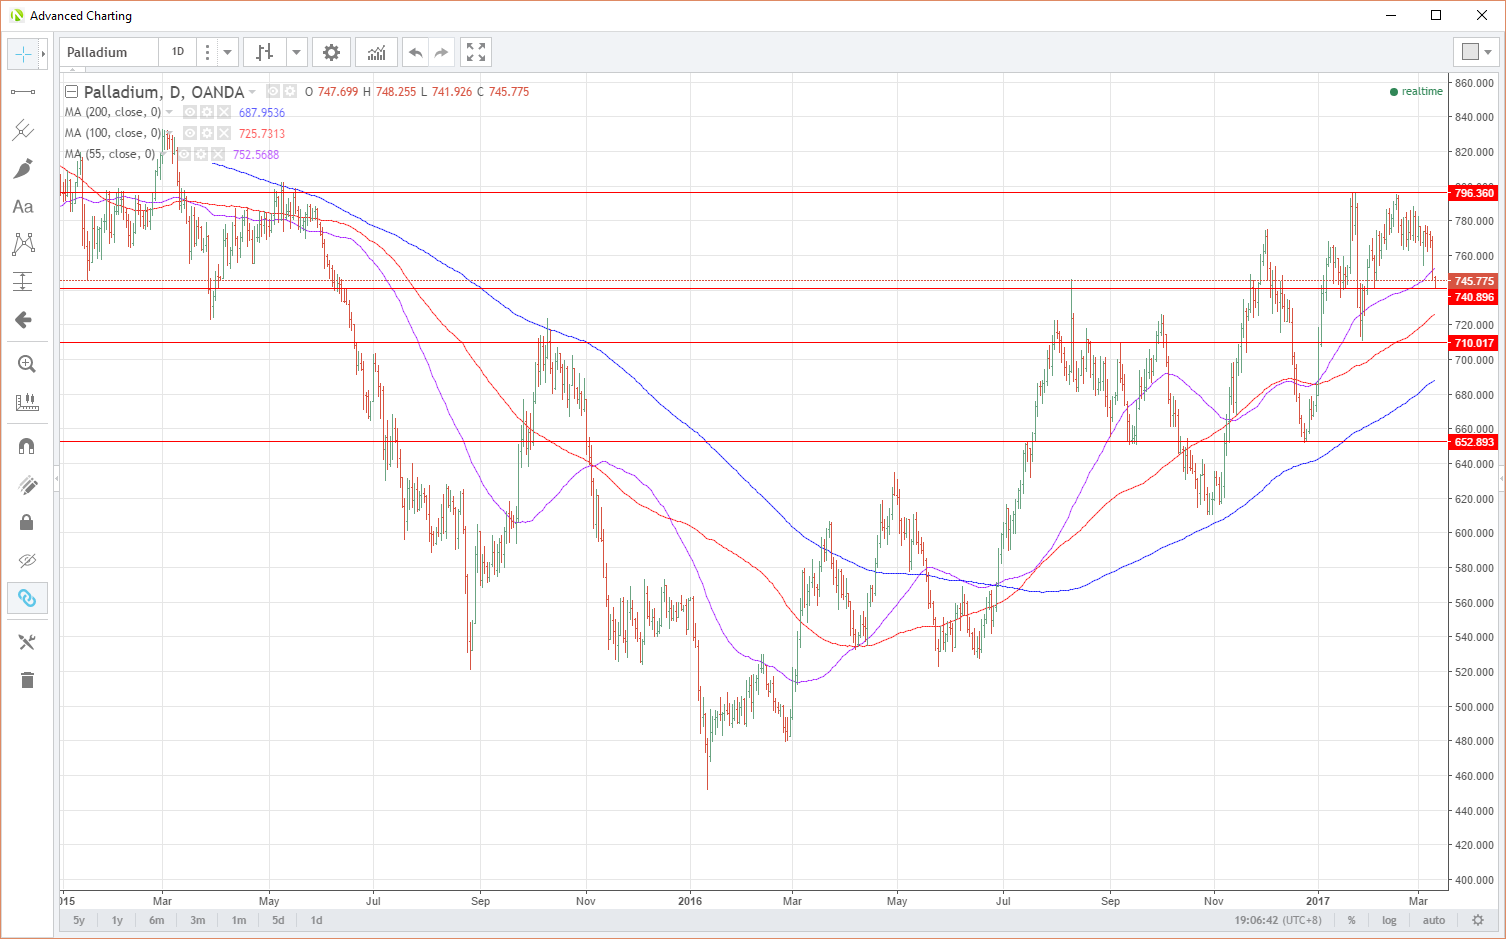
Resistance is just above its 745.70 level at 752.60, the 55-dma. After that, we have the formidable 796.50 area where Palladium has failed numerous times but with a relatively small pullback, until now.
There are a lot of technical supports below. The days low and also a double bottom at 741.00. The 100-dma at 725.70. Previous lows at 710.00 with the 200-dma at 688.00 and Decembers low at 653.00 below. Although it has been an ugly few days, from a bigger picture and technical perspective, Palladium is far more constructive than its brother and sisters.
Platinum
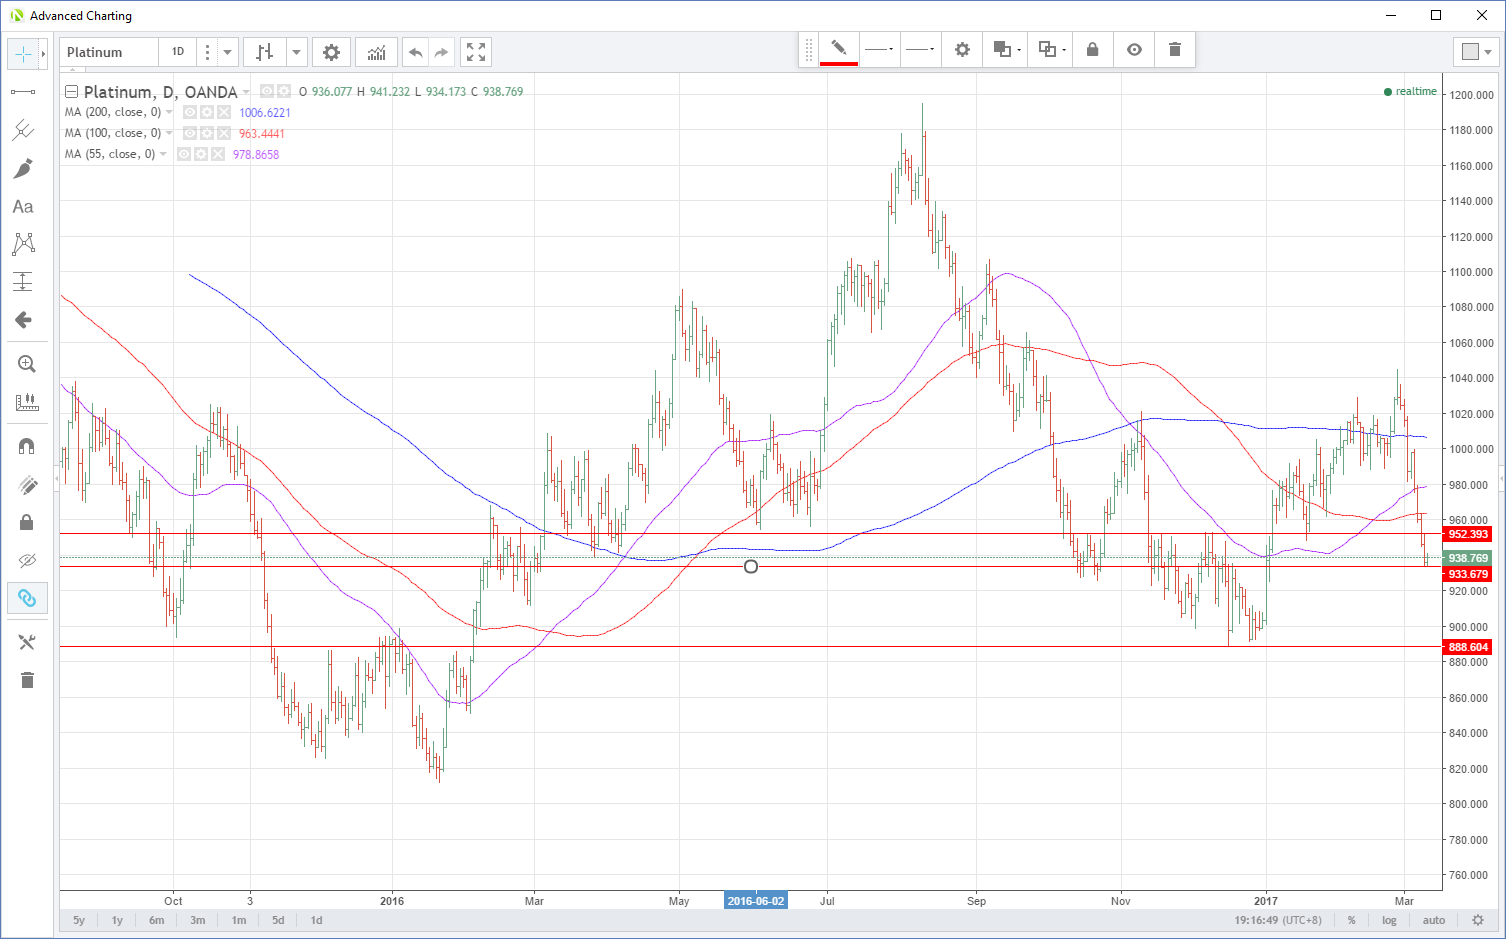
Platinum is already 21% lower than its 2016 highs in July. If Platinum’s price action were a roller coaster over the last year, it would probably be shut down for safety reason. The chart appears to be showing a giant head and shoulders formation forming which could imply a significant move down is on the cards. I will come back to this next week once I have observed more price action. Watch this space!
Zeroing into the here and now, Platinum has broken its 200,55 and 100-dma at 1006.60, 978.90 and 963.45 respectively, all within the last seven days! These all become resistance now along with 952.40 the original break-up level early January.
With platinum trading at 939.00, the first support is the overnight lows at 933.70. After that, yet again, a lot of clear air opens up on the charts until December’s lows at 888.60.
Summary
Although most of the charts look negative from a technical perspective, it is important to note we have come a long way in a short time. That said, the short-term price action will be determined by today’s Non-Farm Payrolls and their effect on the FOMC rate decision next week. A big miss to the downside could possibly see some relief for precious metals. A number near to or above could see more downside pain ahead.
Content is for general information purposes only. It is not investment advice or a solution to buy or sell securities. Opinions are the authors; not necessarily that of OANDA Business Information & Services, Inc. or any of its affiliates, subsidiaries, officers or directors. If you would like to reproduce or redistribute any of the content found on MarketPulse, an award winning forex, commodities and global indices analysis and news site service produced by OANDA Business Information & Services, Inc., please access the RSS feed or contact us at info@marketpulse.com. Visit https://www.marketpulse.com/ to find out more about the beat of the global markets. © 2023 OANDA Business Information & Services Inc.


