Despite an early sell-off in Asia trading, crude has rallied to rest almost unchanged on the day.
All said crude has held up reasonably well as the week starts, following Friday’s Baker Hughs Rig Count showing shale had added another 14 rigs and U.S. oil production was topping 9.1 million barrels a day (bpd). That is an increase of 600,000 bpd since the mid-year and certainly, puts a hole in OPEC/NOPEC’s attempts to chop 1.8 million barrels per day. Interestingly, much of the talk of impending doom on the supply front later in the year seems to have quietened down pretty suddenly as well as the crunch date gets put back by commentators.
If this sort of information had come out at the start of last week, I can only imagine what the reaction would have been. More adrenalin to the panic selling I would imagine. As it is, although Asia had an initial selloff of about 0.5% this morning; we move into European trading almost unchanged. So both Brent and WTI seem to be settling calmly into a new trading range which is a surprise in itself given the histrionics last week. I think a couple of dynamics are at work here.
Firstly we have now passed the predicted FOMC Fed Funds rate hike. That seems to have been so well telegraphed, that the actual event was a bit of a non-event. Will still no concretely policies from the Trump administration’s 100 days of inaction, USD bulls have taken some risk of the table with the big dollar soft against most currencies and commodities, and U.S. yields a bit lower. This has also been supportive of oil.
Secondly, the CME Commitment of Traders (COT)report released over the weekend which encompasses positioning in the CME futures up until last Tuesday, showed a massive 23% drop in speculative long positioning in the WTI contracts. Overall, at net long 288,774 contracts, this is also far below the record longs of 413,637 seen earlier year on year. So in a nutshell, a lot of speculative longs have cut their positions.
A couple of caveats here, firstly the COT report does not encompass Wednesday’s FOMC meeting or the rest of the week. Secondly, given that WTI (and Brent) rallied before selling off again post FOMC, we don’t know just how much the “herd” has been thinned. We will have to wait until next Monday morning for that. Although the report is backward looking, it does provide a fascinating and useful insight into market positioning. My take is that given both Brent and WTI had choppy price action within a largish range, the fact that we have come nowhere near retesting the lows implies that the herd further thinned itself over the course of the week.
Before oil bulls get all excited again, it is important to note that the markets seem to have fallen into a lethargic range pattern. Traders would be far better off concentrating on this in the short term before the API and EIA crude inventory numbers come out later this week. We also have either Fed. Governors are speaking including the Chair, Ms. Yellen this week. So trading becomes a business of watching the short term levels, while keeping an eye on the major levels for an indication of multi-day moves.
Turning to the short term charts.
Spot Brent Crude
The hourly chart support just below current levels at $51.10 and $51.00. Short term resistance lies at $51.90 and then $52.35.
Major support is at the $49.90/$50.00 level, last week’s low. Major resistance is at $52.575, last week’s high.
The hourly MACD gives no real clues at these levels supporting the near time range trade argument.
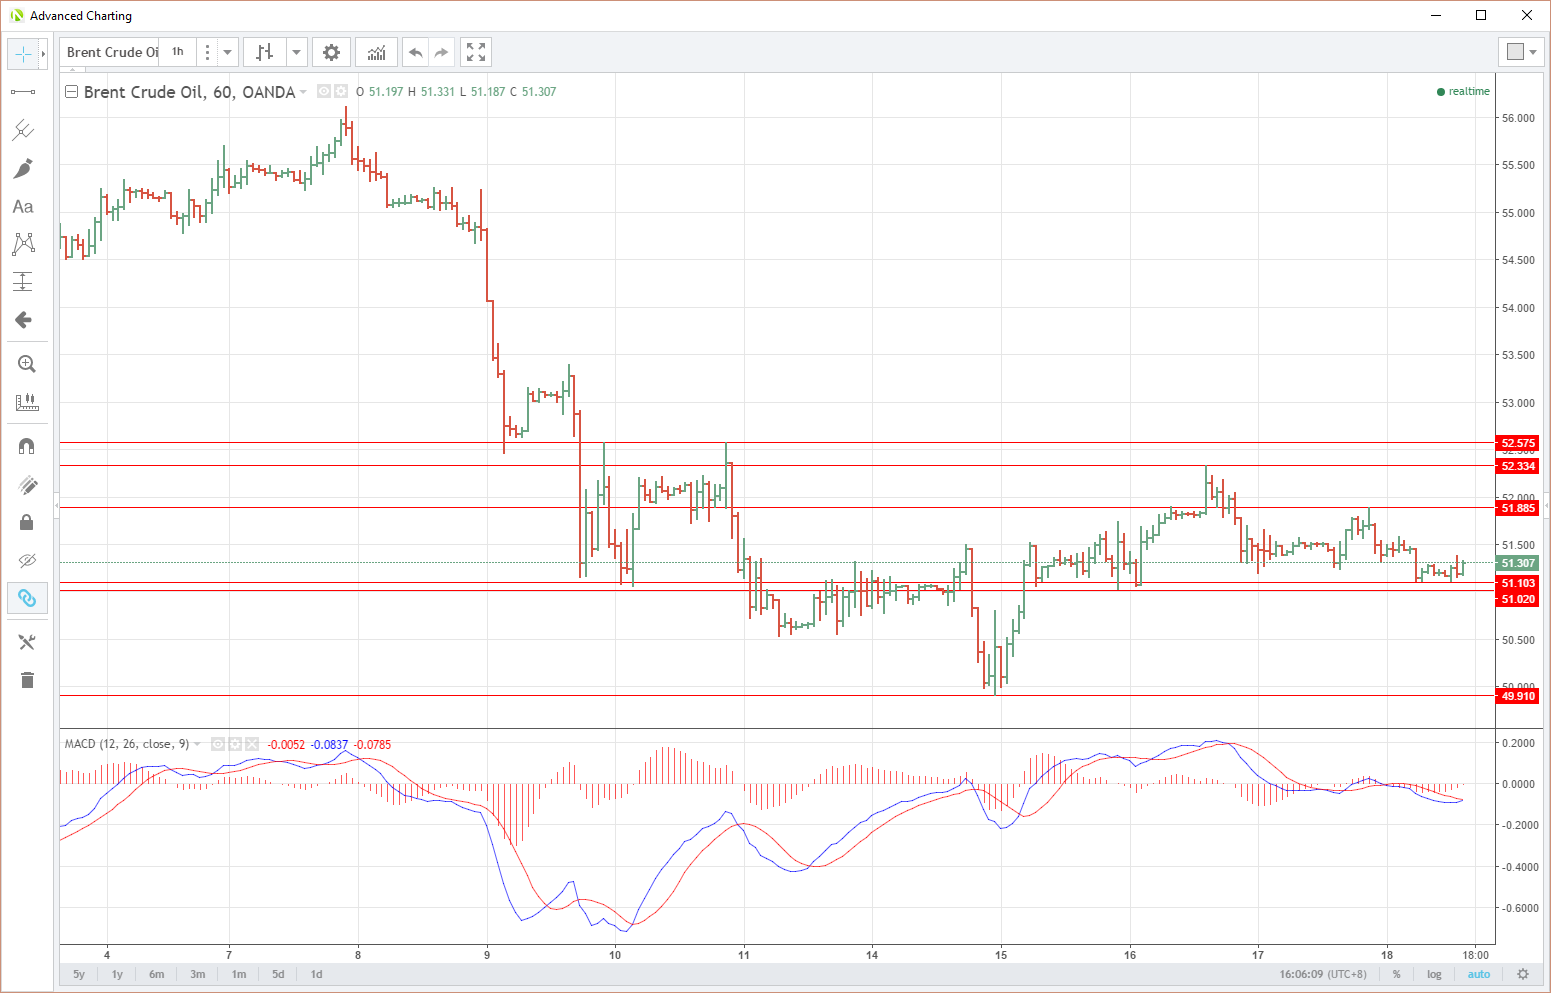
Brent Hourly
Spot West Texas Intermediate
Short term support rests again, just below current levels at $48.20 and $48.05 areas.
Short term resistance lies at $49.05 and $49.45 areas.
Major support is at the $47.00 area and the major resistance at the $49.90/$50.00 area. Respectively last weeks low and high.
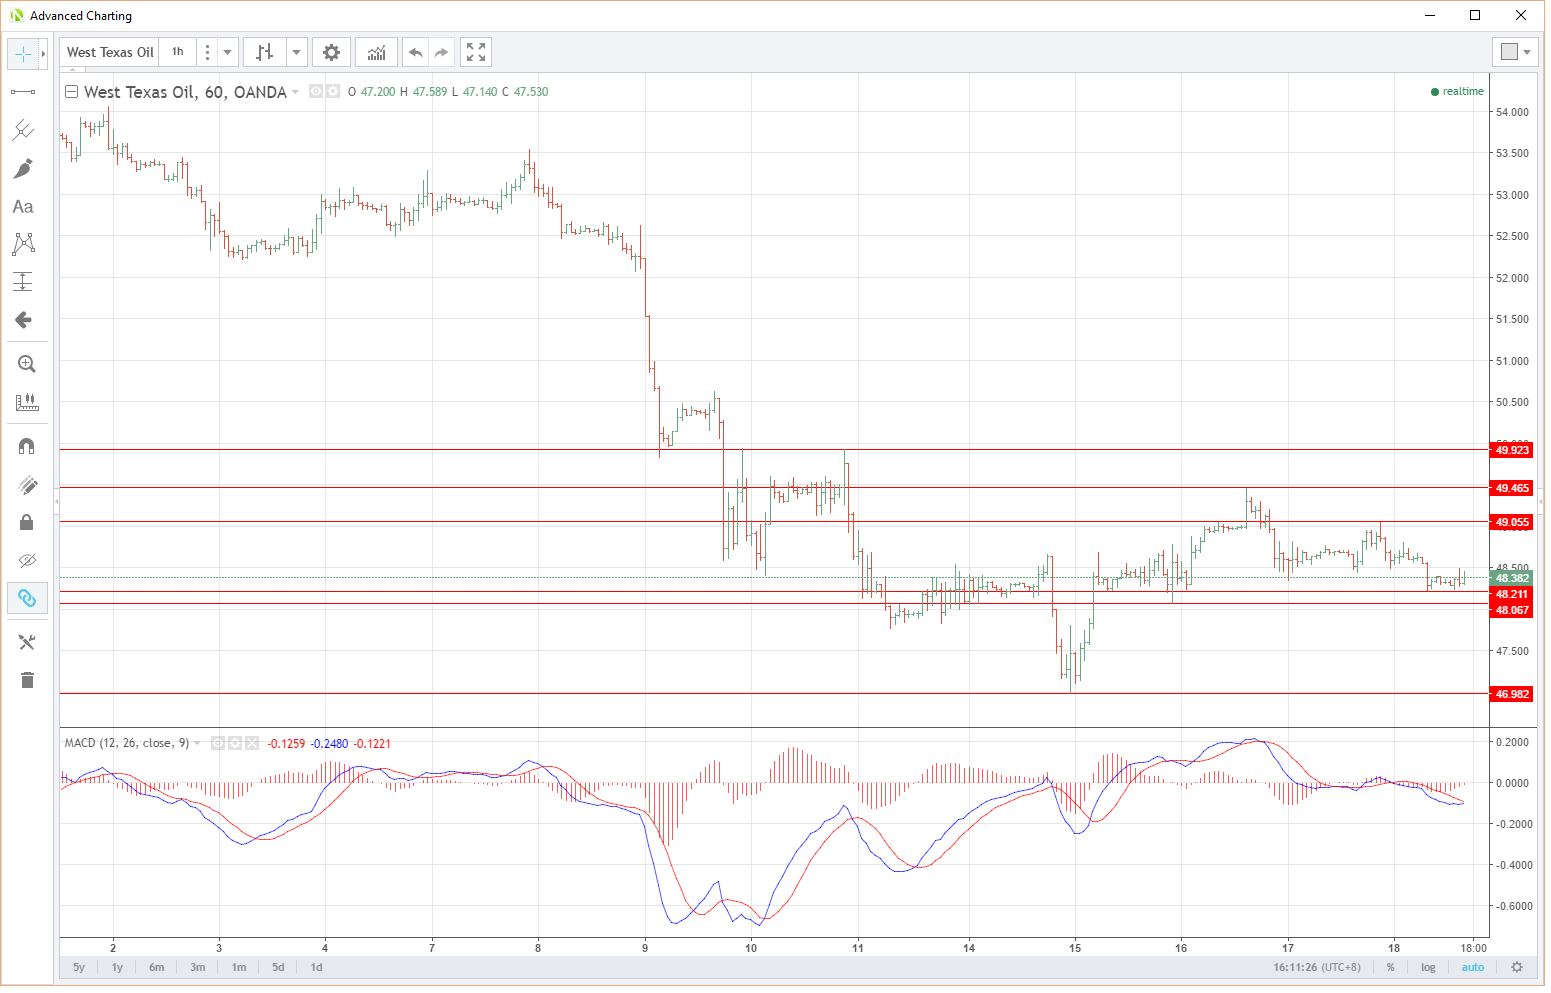
WTI Hourly
Summary
Both crude’s look set for a period of ranging consolidation in the short term. Traders should play this of the short-term levels. However, this is unlikely to last with speculative long positioning almost certainly whittled down massively. Therefore it is important to keep an eye on the “big picture” levels for clues to the next move.
Content is for general information purposes only. It is not investment advice or a solution to buy or sell securities. Opinions are the authors; not necessarily that of OANDA Business Information & Services, Inc. or any of its affiliates, subsidiaries, officers or directors. If you would like to reproduce or redistribute any of the content found on MarketPulse, an award winning forex, commodities and global indices analysis and news site service produced by OANDA Business Information & Services, Inc., please access the RSS feed or contact us at info@marketpulse.com. Visit https://www.marketpulse.com/ to find out more about the beat of the global markets. © 2023 OANDA Business Information & Services Inc.
Jeffrey Halley
Latest posts by Jeffrey Halley (see all)
- Oil slides, gold rally continues - 5 August 2022
- US dollar retreat continues - 5 August 2022
- Pelosi relief rally in Asia - 5 August 2022