A surprise inventory draw saves oils blushes, but gold cannot hide from higher U.S. yields and dollars.
OIL
The overnight crude inventory data came in at a surprising 1.8 million barrel drawdown against an expected 3.4 million barrel surplus as U.S. refining’s comeback continues at pace. This supported WTI, keeping the profit taking wolves from the door, allowing it to finish unchanged at 51.70 as Brent fell 1.25% to close at 57.50.
Although both contracts remain overbought on shorter-term technical indicators, they are now less so although not out of the woods yet. The charts are still signalling that both are vulnerable to what would be a healthy technical correction within an overall uptrend as we head into the week’s end.
Brent spot is perched just above daily support at 57.40 with a break suggesting further falls to the 56.50/57.00 area initially. Resistance is now layered at 58.50, 59.10 and then the mighty 60.00 regions.
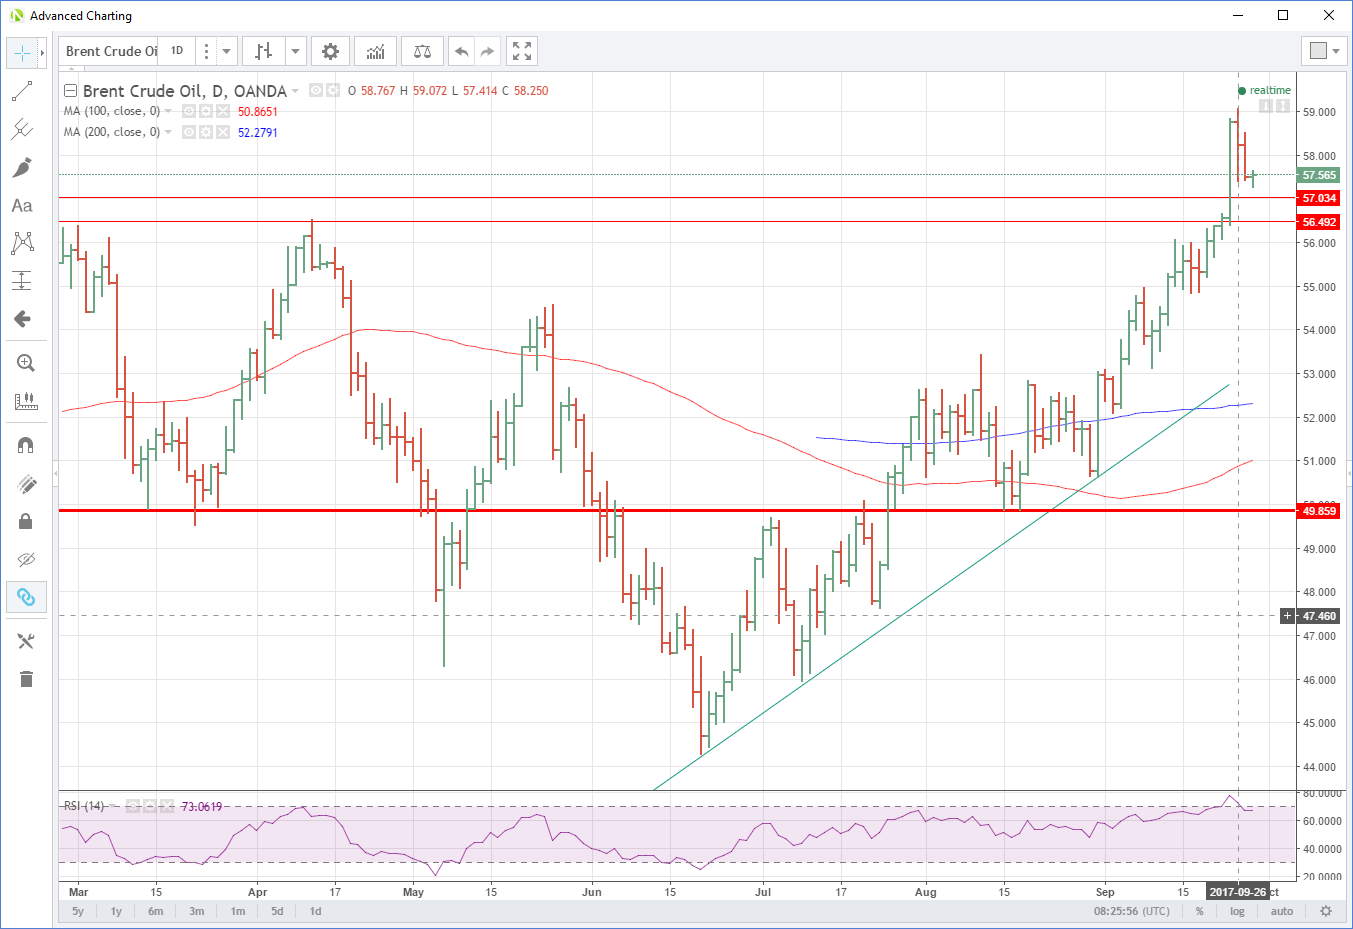
Brent Daily
WTI spot trades ar 51.70 with nearby resistance at 52.00 followed by 53.50, the start of the long-term resistance region. Initial support lies at 51.00 with a break suggesting further retracement to 50.30.
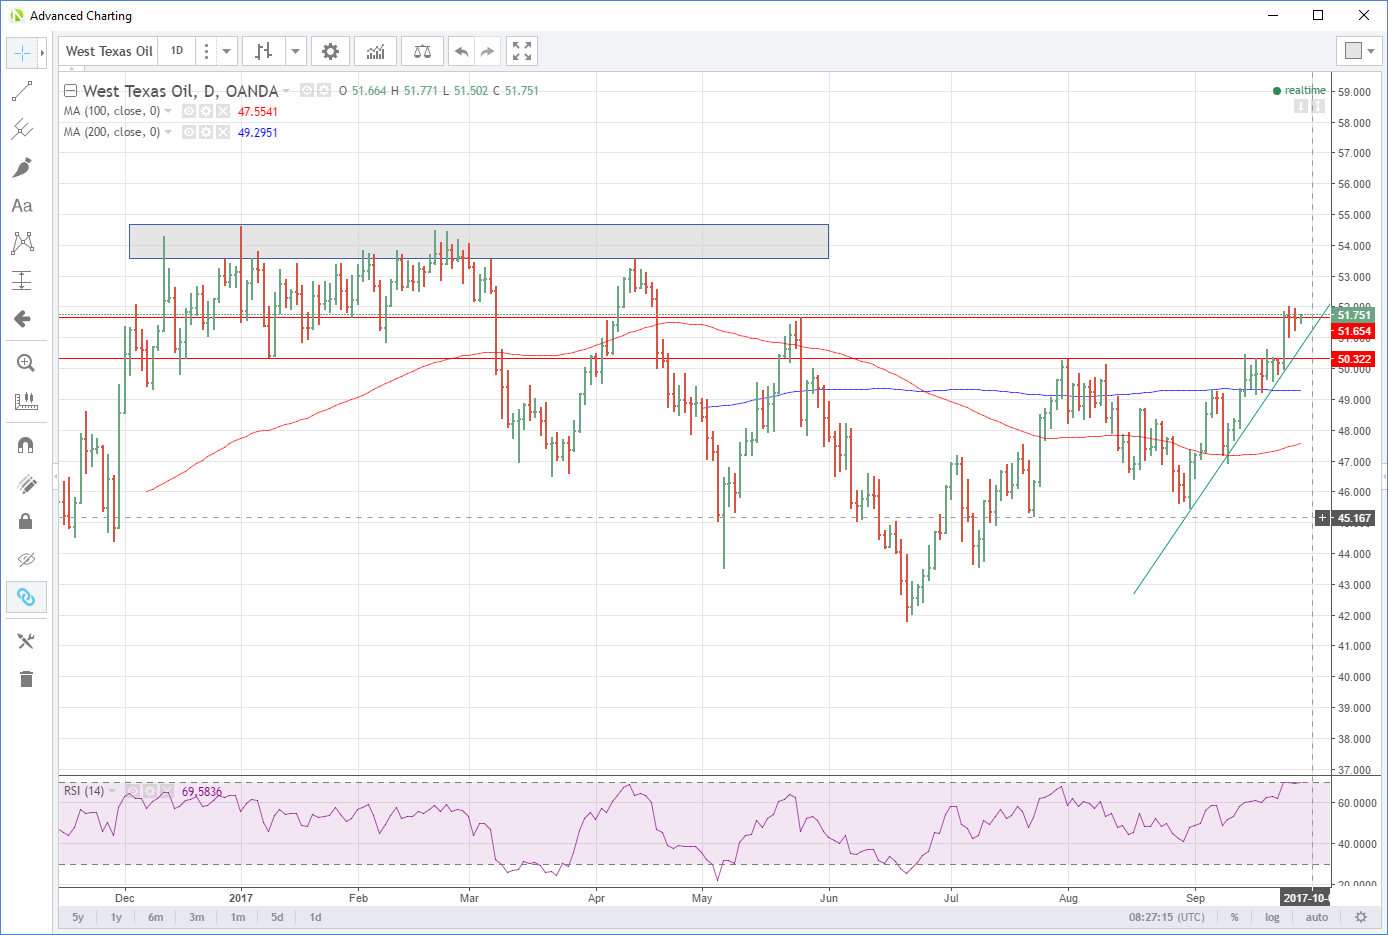
WTI Daily
Gold
Gold collapsed by another 10 dollars overnight, finishing the New York session at 12.83.20 and leaving it clinging to its medium-term support region by its fingertips. Higher U.S. yields and continued strength in the U.S. dollar post-President Trumps tax announcements has eroded golds asset appeal in the absence of geopolitical sabre rattling in the last couple of days.
Although tomorrow may see some risk hedging buying ahead of the weekend, it is becoming clear that U.S. strength and U.S. bond yields are the primary drivers affecting precious metal pricing. Geopolitical headlines and events will lend short-term respite, but it appears the effects are becoming increasingly transitory.
The bottom of the theoretical gold retracement box lies at 1281.00, and a daily close below this level would suggest that the uptrend from early July would be officially over. This would lead to a test of the 100-day moving average at 1271.00 initially followed by the 61.80% retracement at 1263.00.
Resistance has now reformed at the 1296.00, the original longer-term breakout point followed by an equally distant 1313.00 region.
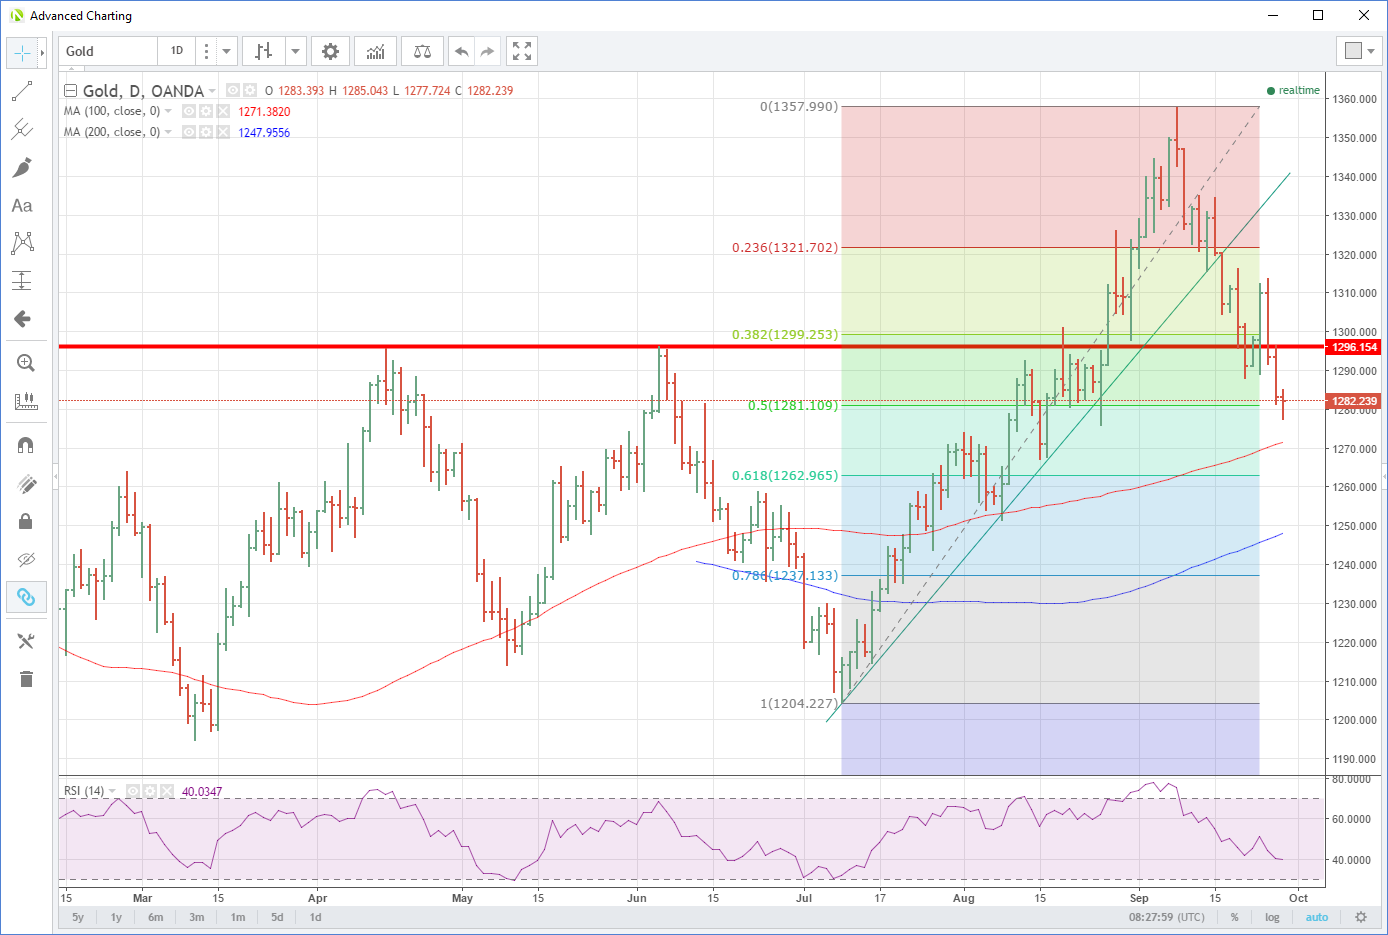
Gold Daily
Content is for general information purposes only. It is not investment advice or a solution to buy or sell securities. Opinions are the authors; not necessarily that of OANDA Business Information & Services, Inc. or any of its affiliates, subsidiaries, officers or directors. If you would like to reproduce or redistribute any of the content found on MarketPulse, an award winning forex, commodities and global indices analysis and news site service produced by OANDA Business Information & Services, Inc., please access the RSS feed or contact us at info@marketpulse.com. Visit https://www.marketpulse.com/ to find out more about the beat of the global markets. © 2023 OANDA Business Information & Services Inc.
Jeffrey Halley
Latest posts by Jeffrey Halley (see all)
- Oil slides, gold rally continues - 5 August 2022
- US dollar retreat continues - 5 August 2022
- Pelosi relief rally in Asia - 5 August 2022