President Trump’s update on its Iran relations today has the oil market nervous, overshadowing this evening’s U.S. CPI.
Brent and WTI limped quietly into the week’s end overnight with the price action with the price action neutral as the dust settles. WTI outperformed as the DOE Crude Inventories showed a higher than expected 2.7 million barrel drawdown and strong export figures. It was somewhat mollified though, as gasoline inventories revealed a higher than expected build as U.S. refining gets back online following the hurricanes.
Brent also rallied initially but was capped as the International Energy Agency (IEA) said that the market was rebalancing well but that this was mostly fully priced into the markets for now. Further price increases would require stronger action from oil producers. This one hand gives, one hand takes away outlook took the wind out of Brent sails with it settling mid-range at 56.50.
The Asia session took an altogether brighter view with both contracts climbing steadily throughout the day. Traders digested the overnight inventory figures along with very strong Chinese data showing that it imported 9 million barrels per day over September, making it easily the largest importer of oil in the world.
It is President Trump’s speech its future relations with Iran and the nuclear deal that has probably caused most of the upward pressure in oil, however. The threat of renewed sanctions and a decrease in Iranian oil flowing to world markets supporting both contracts throughout the Asia session.
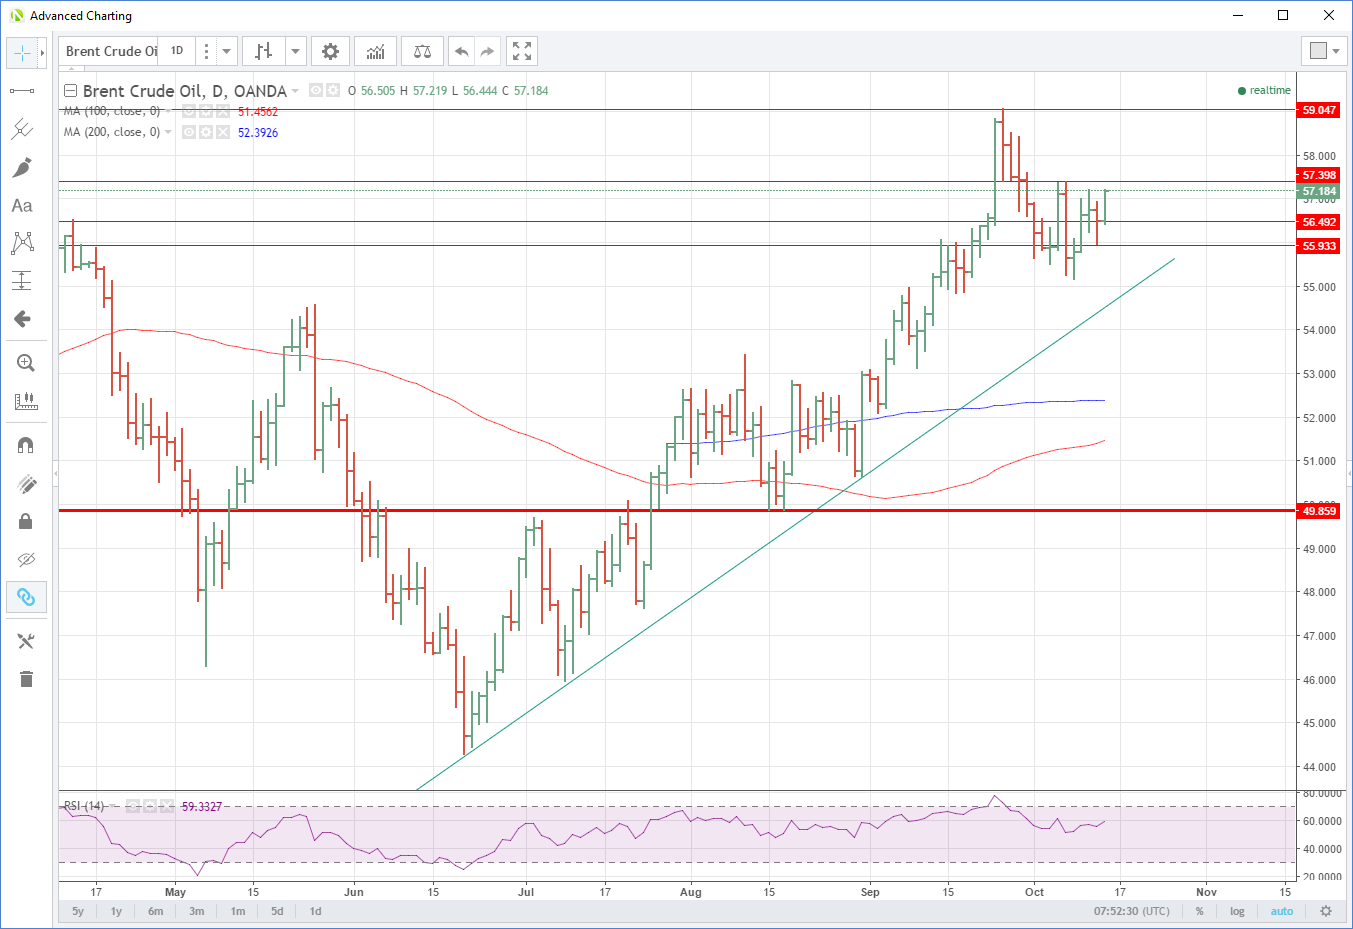
Brent has climbed to 57.15, up 1.05% for the day. Resistance is at 57.40, a double top from Thursday and Friday. Beyond this level, the charts show clear air until 58.50 and then the formidable 59.00 regions. Support is at 56.40 followed by 56.00 and then 55.00.
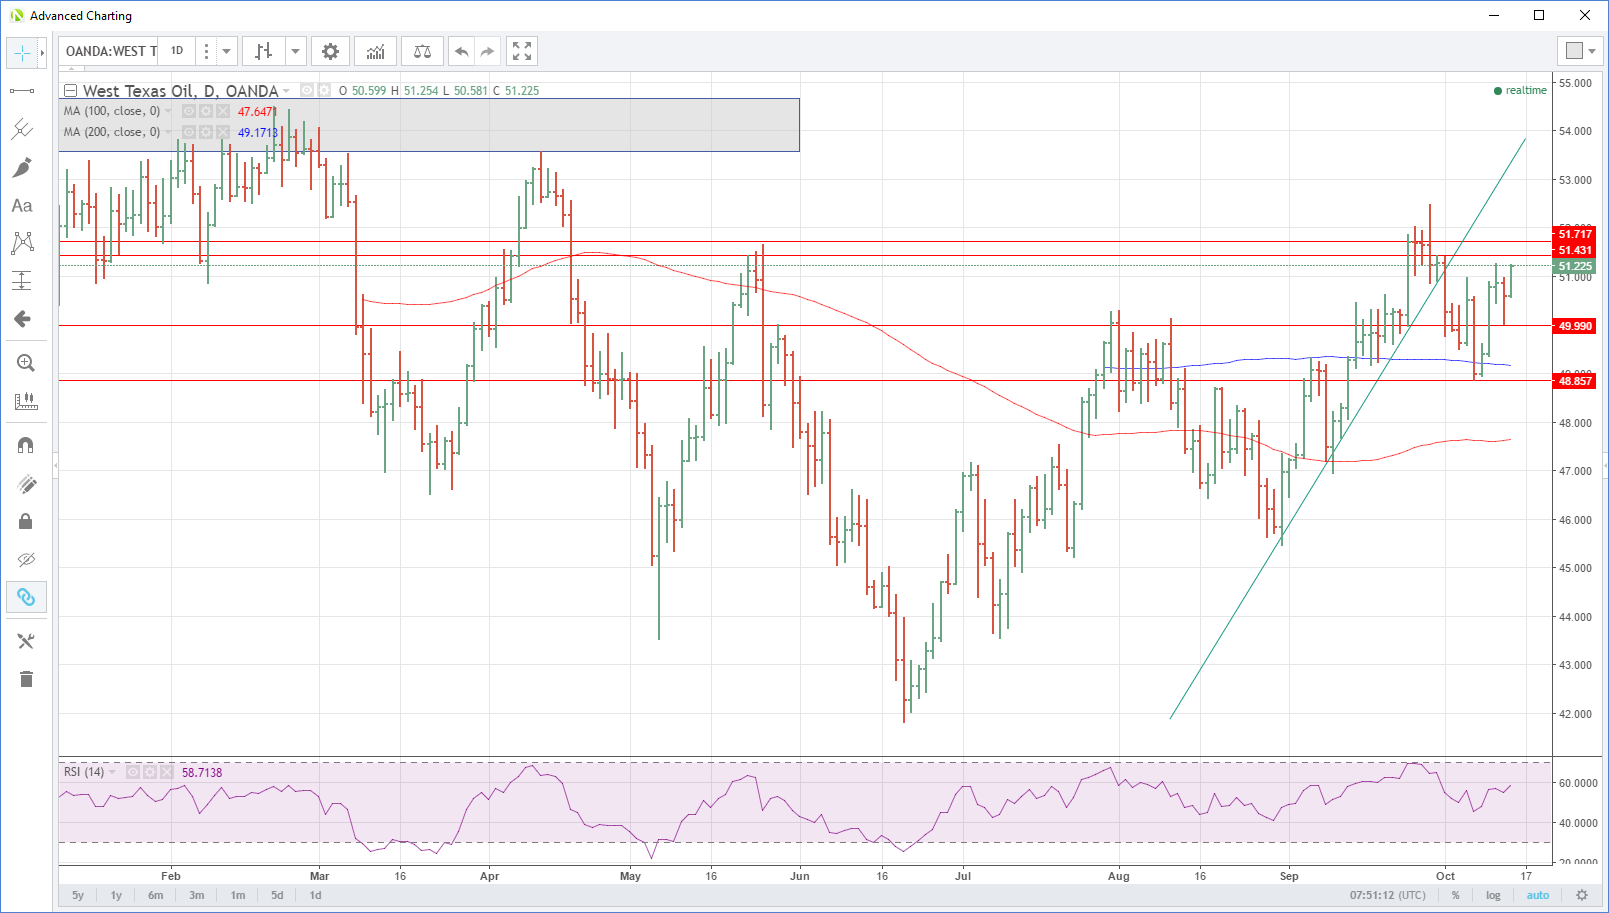
WTI has clambered higher by 1.20% to trade at 51.20 as Europe gets underway n earnest. It has resistance nearby at 51.25 and then a double top at 51.45. A break of this level clears the way for a retest of September high at 52.50. Support is at 50.55 followed by 50.00. A break of that level would suggest the rally has ended for now, and a move towards the 200-day moving average at 49.20 is more likely.
Content is for general information purposes only. It is not investment advice or a solution to buy or sell securities. Opinions are the authors; not necessarily that of OANDA Business Information & Services, Inc. or any of its affiliates, subsidiaries, officers or directors. If you would like to reproduce or redistribute any of the content found on MarketPulse, an award winning forex, commodities and global indices analysis and news site service produced by OANDA Business Information & Services, Inc., please access the RSS feed or contact us at info@marketpulse.com. Visit https://www.marketpulse.com/ to find out more about the beat of the global markets. © 2023 OANDA Business Information & Services Inc.


