Are We Looking at an Overcrowded Market?
It’s difficult to find anyone at the moment that isn’t bullish on this pair in the long term and under the current circumstances, they may have a point. However, these markets don’t move in a straight line (even bitcoin as the last couple of months has shown us) and corrections along the way are both normal and healthy.
So when I ask if the rally is running out of steam, I’m not necessarily calling a top in the pair and in this case, I’m certainly not. What I’m suggesting is that the recent run higher – and once again it’s been a good one – may be looking a little overstretched and a pull-back could be on the cards.
The pair first started to look a little overbought earlier this month when it failed to make a new high and even appeared to have formed a small double top, but as we saw, the dollar bashing wasn’t quite over yet and despite breaking the neckline, we didn’t see much of a pull-back before it was once again tearing higher.
EURUSD Daily Chart
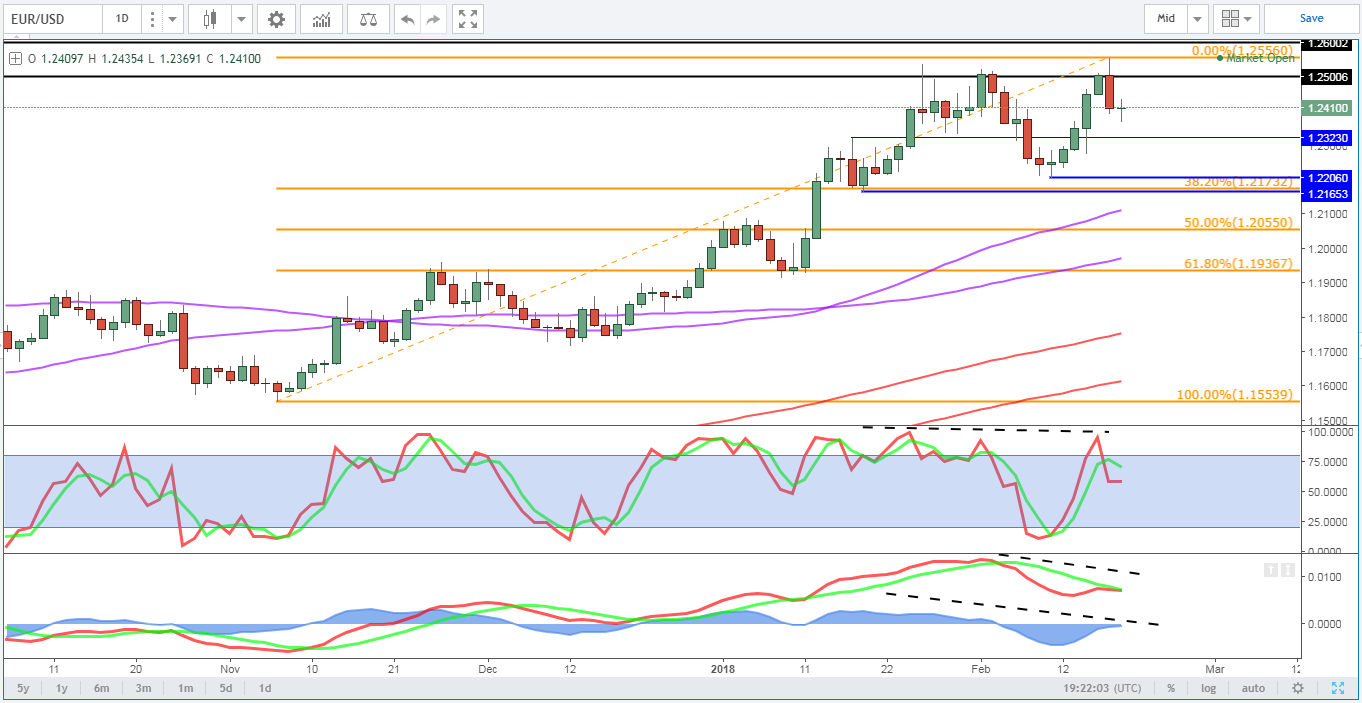
OANDA fxTrade Advanced Charting Platform
Once again though, we find ourselves testing the 1.25 region and we appear to be finding a lot of resistance. The two notable differences on this occasion though is that we did make a new high and we did not have the momentum indicators – MACD and stochastic – confirming the moves. This has left us with a negative divergence between price and momentum that is red flag for the bulls.
USD/JPY – Yen Edges Lower in Thin Holiday Trade
It’s worth noting at this point that a divergence in itself is not a sell signal, nor does it indicate that a pair won’t make a new high. It quite easily could, although if it does so with less momentum again, this would be a second red flag and further suggest that a correction may be coming. If a new high is made on rising momentum it would, however, suggest that bulls have found further reason to be bullish and negate the previous red flag warning.
With the pair now showing a divergence though and Friday’s daily candle looking rather bearish, having rallied above Thursday’s high and closed well below its low, I wonder whether the downside is at least going to be tested.
The first interesting level for me is 1.2320, this was a resistance level in mid-January that became support shortly after and then the neckline of the double top that never fully completed it’s corrective projection. While we broke above here quite easily on the way back up, it could prove more tricky this time if indeed the market is still bullish. A break below may be an early correction confirmation signal.
Gold Trading Sideways in Thin Holiday Trade
The more interesting level is 1.22 though, with it being roughly the area where the last two dips found support. A failure to do so on this occasion would be a bearish signal and could create an imperfect double top with the neckline here and the peaks being 25 January and 16 February highs. It would also signal an arguably overdue correction in the dollar with the last having been a little brief considering the move that preceeded it.
Given the size of the double top – roughly 1.25 to 1.22 – this could give us a possible price projection of 300 pips, creating possible support around 1.19. This would bring us back to a prior area of support and resistance and represent a 61.8% retracement from the November lows to the recent highs at which point traders longer term bullish appetite could be tested.
Content is for general information purposes only. It is not investment advice or a solution to buy or sell securities. Opinions are the authors; not necessarily that of OANDA Business Information & Services, Inc. or any of its affiliates, subsidiaries, officers or directors. If you would like to reproduce or redistribute any of the content found on MarketPulse, an award winning forex, commodities and global indices analysis and news site service produced by OANDA Business Information & Services, Inc., please access the RSS feed or contact us at info@marketpulse.com. Visit https://www.marketpulse.com/ to find out more about the beat of the global markets. © 2023 OANDA Business Information & Services Inc.

Former Craig
Latest posts by Former Craig (see all)
- Market Insights Podcast – US GDP, RBNZ holds, bitcoin soars - 28 February 2024
- Market Insights Podcast – Nvidia earnings, record highs for stocks - 23 February 2024
- EUR/USD – A bullish breakout or just further consolidation? - 22 February 2024