Soft commodities are mostly enjoying a revival from multi-month lows as weather-related issues raise supply concerns. Weather is also affecting crude oil and natural gas prices, while precious metals hold steady and industrial metals slide amid the ongoing US-China trade war.
Agriculturals
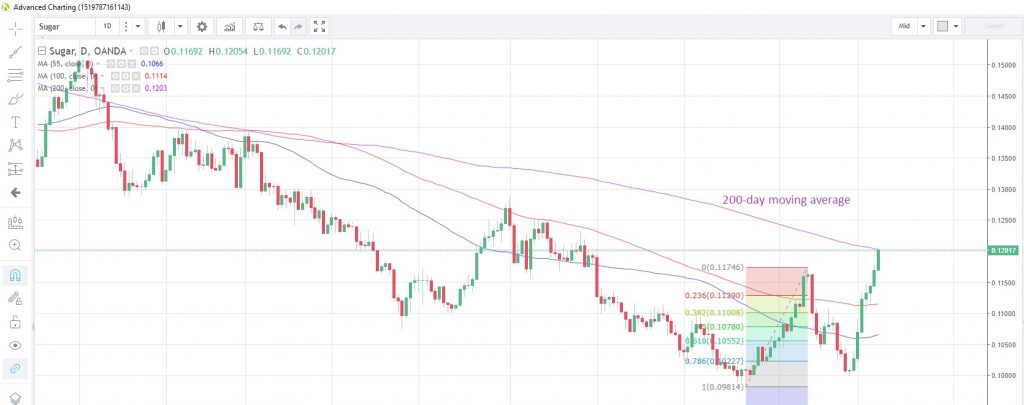
SUGAR saw its biggest one-week rally since December 2016 last week, jumping 13.8% as reports suggested there may be less supply during the current season. A report from the USDA Foreign Agricultural Service published last week predicted that output from Brazil, Thailand and the EU would be lower during the period to March 31 compared to the last season.
The commodity has risen for the past eight sessions and tested the 200-day moving average, which has capped prices on a closing basis since January 9. The moving average is at 0.1203 with sugar prices closing at 0.12017 yesterday.
Daily Sugar Chart
WHEAT is trading negatively today, having failed to sustain moves above the 100-day moving average on numerous attempts during the past week. Vietnam recently banned wheat imports as harmful seed was discovered in some shipments. Russia’s exports are likely to suffer most near-term, since Vietnam is the country’s third-biggest export market. Wheat is now trading at 4.967 with the 100-day moving average at 5.0534.
CORN reached its highest level in seven weeks yesterday as the forecast of heavy rain and flooding in the US Midwest raise concerns about crop yields. Corn has rallied 7.9% from the September 18 low, falling short of the 9.4% rebound seen in July. The commodity is currently at 3.5530, sitting just below the 100-day moving average at 3.5532, with the 200-day moving average above at 3.6160 acting as the next resistance point.
SOYBEANS are trading near three-week highs as the weather continues to cloud harvest forecasts. Wet weather in the US Midwest is causing harvesting delays and raising concerns about potential crop damage. The commodity is at 8.6580 today, climbing toward the 100-day moving average at 8.7940, which has contained prices since June 4.
Precious metals
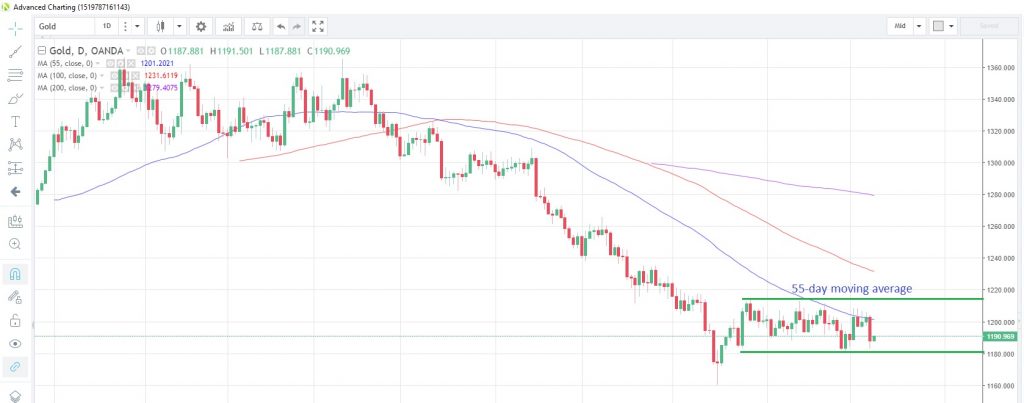
Speculative accounts added to net short GOLD positions for the third straight week in the week to October 2, pushing net short positioning to its most-bearish since May 2001, according to the latest data from CFTC released last Friday. Gold prices are still trading within the confines of the 1,220 – 1,180 broad corridor, as it has done for the past seven weeks, and has failed to convincingly breach the 55-day moving average on repeated attempts during the past week. Gold is now at 1,191.00 with the 55-dat moving average at 1,201.20.
Daily Gold Chart
SILVER is also struggling to overcome the 55-day moving average which has contained prices on a closing basis since June 14. The precious metal is now at 14.4162 with the moving average above at 14.6990. Speculative accounts reduced their net short positions for the fourth straight week in the week to October 2, according to the latest CFTC data, and are now at their lowest level in over a month.
The Gold/Silver (Mint) ratio has bounced off the 55-day moving average after a more than 5% fall from its 10-year high on September 11. The ratio is at 82.627 today with the moving average supporting at 81.7850.
PLATINUM is stuck between the 100-day moving average at 835.90 and the 55-day moving average at 809.51 and is waiting for a breakout in either direction. Speculative positioning data as at October 2 shows net buying for the fourth straight week, and is now at its most bullish since May 15.
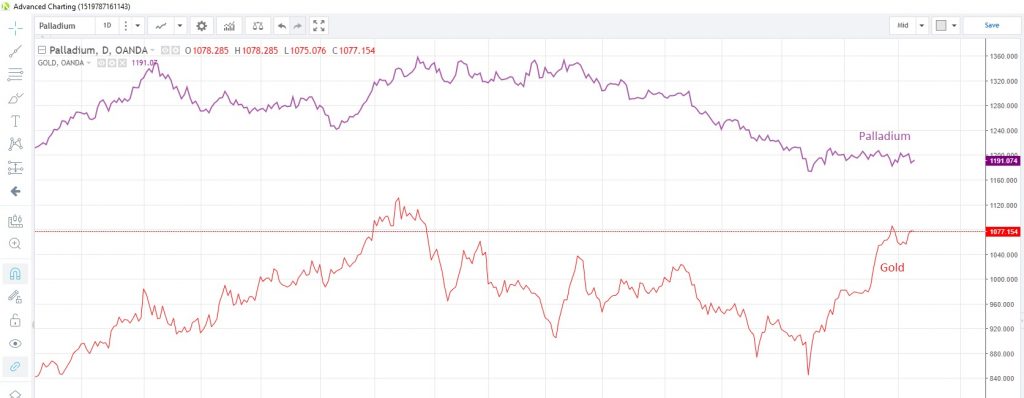
PALLADIUM continues to outshine its precious metal cousins despite posting its first down-week in three last week. The precious metal is trading just below 8-1/2 month highs at 1,076.92 and has narrowed the spread to gold to about 113 pips from 223 pips at the start of the year. Speculative accounts have been net long of palladium since 2003 and current bullish bets are at a 14-week high.
Palladium vs Gold Daily Chart
Base metals
COPPER hit a 2-1/2 week low yesterday but managed to stay above the 55-day moving average. Prices touched 2.7113 as concerns remained about the true impact on demand of the US-China trade tensions. Indeed Chile, the world’s biggest copper miner producing nearly a quarter of the world’s supply, has said it intends to seek out new copper markets and expand its lithium industry in order to shield the economy from the effects of the Sino-US trade war. Copper has fallen as much as 22.4% this year and is down more than 18% since March, when the trade war first started.
Such concerns do not appear to be in the minds of speculative investors, who increased bullish bets on the industrial metal to their highest since July 10, according to the latest CFTC data. The metal is poised for its second consecutive up-day and is currently at 2.7601. The 100-day moving average should act as resistance 2.8236, as it has done on a closing basis since June 19.
Energy
CRUDE OIL looks poised to snap a three-day losing streak as weather-related concerns raise the specter of disruptions to supply. Reuters reports that offshore platforms in the Gulf of Mexico are being evacuated, halting nearly a fifth of production, as tropical storm Michael is upgraded to hurricane Michael and is expected to strengthen and head up the Gulf.
Prior to the weather-related news, oil prices were retreating from four-year highs amid rumors that the US may permit some waivers to some countries on Iran sanctions. This would reduce the impact of supply shortfalls which are scheduled to be fully implemented on November 4. Data released this morning showed Iran’s crude exports fell further in the first week of October, according to tanker data and an industry source, to less than half of the amount they were exporting in April, before US President Trump withdrew the US from the Iran nuclear deal.
WTI is currently trading at $74.786 and prices may find technical support at the 38.2% Fibonacci retracement level of the August 16 to October 3 rally at $72.301. The 55-day moving average is at $70.005.
Anticipated cooler temperatures across the US continue to support NATURAL GAS demand, with prices hitting the highest levels since end-January yesterday. Hurricane Michael’s potential impact on production is also driving prices higher. Gas saw its biggest one-day rally since January 23 yesterday, touching the strongest since January 31. It is now at 3.297.
Content is for general information purposes only. It is not investment advice or a solution to buy or sell securities. Opinions are the authors; not necessarily that of OANDA Business Information & Services, Inc. or any of its affiliates, subsidiaries, officers or directors. If you would like to reproduce or redistribute any of the content found on MarketPulse, an award winning forex, commodities and global indices analysis and news site service produced by OANDA Business Information & Services, Inc., please access the RSS feed or contact us at info@marketpulse.com. Visit https://www.marketpulse.com/ to find out more about the beat of the global markets. © 2023 OANDA Business Information & Services Inc.


