Commodity markets are being influenced by the US dollar’s direction as the results of the US midterm elections unfold. An oversupplied market saw oil prices lower, while precious metals held steady. The agricultural sector is seeing harvests affected by the weather.
Energy
CRUDE OIL is falling for a fifth straight week as the supply worries related to the imposition of Iran sanctions ease. The US announced that eight importers had been given temporary waivers from the Iran sanctions, allowing Iranian oil to still flow to those destinations.
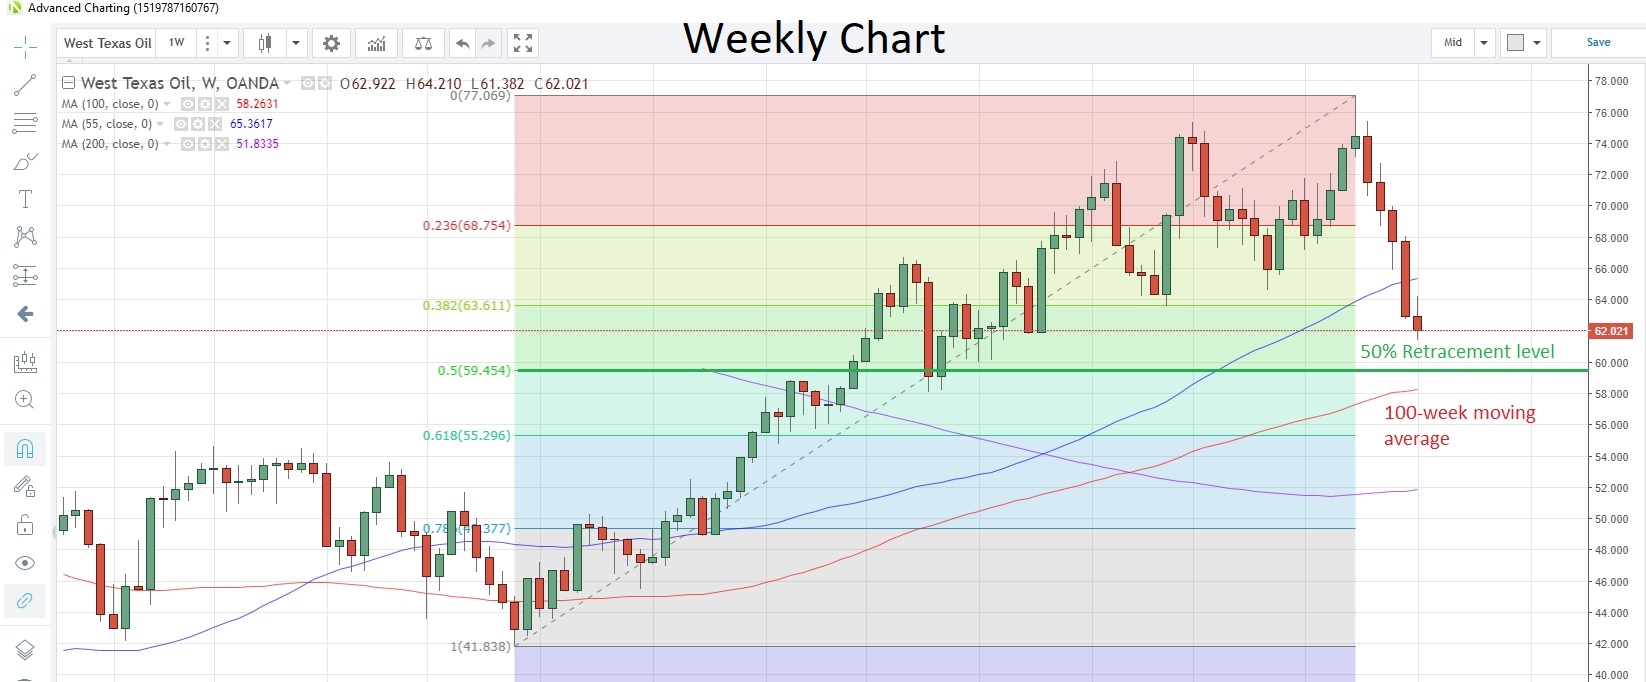
Last week saw the biggest weekly decline since early-February and oil touched the lowest since March 19 yesterday bringing the loss from the peak earlier this month to more than 20%. West Texas Intermediate is currently trading at $61.99, with support possibly found at $59.454, the 50% retracement of the rally from June 21 to October 1, and $58.263, the 100-week moving average. The Brent/WTI spread has been holding steady just below the $10 mark.
WTI Weekly Chart
Weekly API crude stocks data as at November 2 showed another addition to inventories, the third weekly add in a row, this time by 7.83 million barrels. Today’s EIA data is expected to paint a similar picture, with an increase of 2.05 million barrels anticipated.
The EIA has predicted that US crude output will top 12 million barrels per day by mid-2019 as domestic shale output surges. This year’s output is forecast to rise to 10.9 million barrels per day.
NATURAL GAS soared by the most since January 2015 on Monday amid reports that an unusually cold snap is heading for the US next week. The commodity reached its highest point since January 2017 yesterday, and is hovering at 3.497 today.
Agriculturals
Heavy rainfall across the eastern US CORN belt around Mississippi and Ohio is affecting the harvest, which is helping to push corn prices toward three-week highs. Corn is attempting to hold above the 200-day moving average at 3.635 for the second time since August. The previous attempt last month only lasted four days. Corn is currently trading at 3.653.
Last week Bloomberg reported that China’s 2018 corn harvest was the lowest in six years, and it was also noted that corn farmers have yet to make the switch to soybeans, despite high government subsidies being granted. Incentives are being offered to combat the loss of soybean imports due to the US-China trade war.
Corn Daily Chart
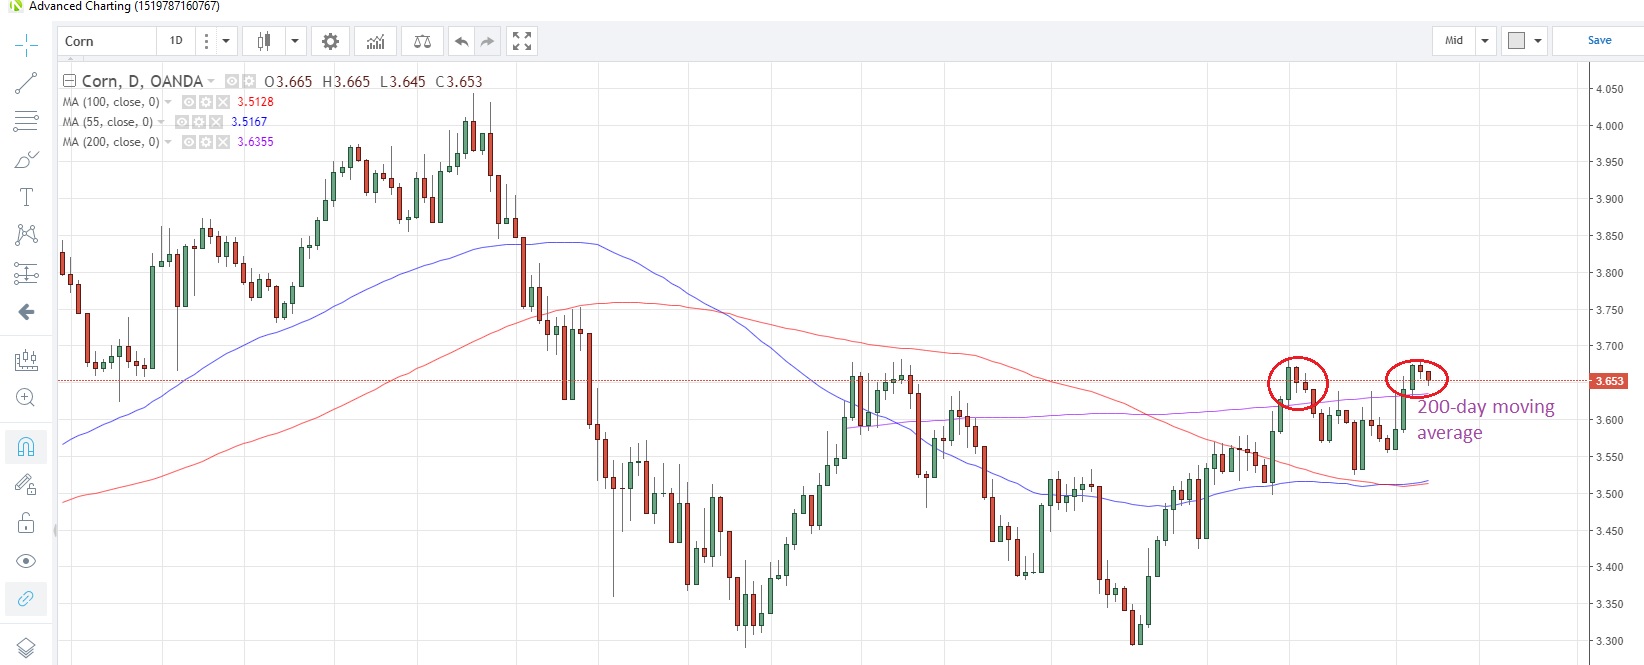
Source: OANDA fxTrade
SOYBEAN prices are currently consolidating last Thursday’s spike higher caused by rumors that the US administration had been tasked with drafting potential terms for a trade agreement with China. Given that there is now a 25% tariff on US imports in China, it was not unreasonable to see a strong rebound. The tariff is having a noticeable impact on trade flows, with China’s soybean imports from the US down 80% y/y in September. In the same period, Brazil’s exports to China increased 30%.
Prices posted the strongest weekly gain in more than two months last week and touched a three-week high of 8.854. Soybeans are now settling at 8.694 with the 100-day moving average at 8.5311.
Heavy rains in Kansas, the US’ biggest WHEAT-producing state, has delayed, and possibly jeopardized, the harvest as the state suffers the wettest October on record. Wheat closed above the 55-day moving average yesterday for the first time in more than two months, and is consolidating around the 100-day moving average at 5.0248 today. Latest reports show that US exports of wheat fell 23% y/y in September.
Rainfall is also affecting the SUGAR harvest in Brazil, with heavy rains forecast for the first half of this month likely to cause delays. Last month Brazil’s exports were down 33%, which was the lowest output for the month of October since 2005, according to Bloomberg calculations.
Sugar is currently trading at 0.12273 and has retreated 5% from the 5 ½ month high struck last month. The 200-day moving average at 0.1186 could be the next support point.
Precious metals
GOLD looks set to fall for a third straight session as the metal struggles to make any headway past technical resistance at 1,235, the 200-week moving average. Speculative investors turned net sellers for the first time in three weeks, according to the latest data snapshot as of October 30 released by CFTC last Friday.
Gold Weekly Chart
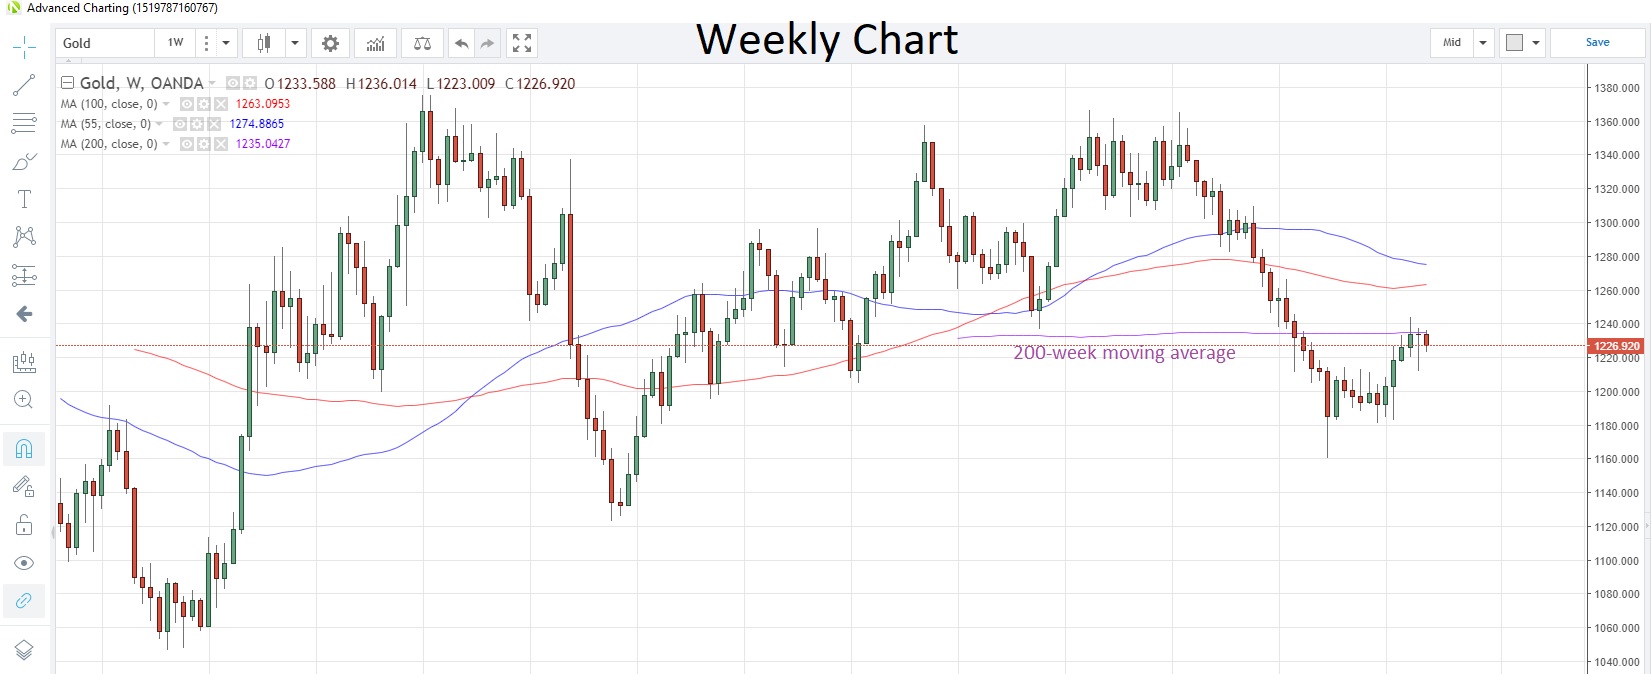
Source: OANDA fxTrade
SILVER remains sandwiched between the 100-day moving average at 14.967 and the 55-day moving average at 14.473. It’s currently at 14.55. The gold/silver (Mint) ratio continues to hold above the 55-day moving average at 83.521, as it has done on a closing basis for more than a month.
PLATINUM is capped by the 200-day moving average at 880.10 and this average has contained prices on a closing basis since March 26. The commodity touched the strongest level since June 25 yesterday and is currently trading at 869.83. Speculative long positioning is at its highest since the week of April 24, according to the latest data as of October 30 from CFTC.
Zimbabwe has targeted an increase in mineral exports to $12 billion a year over the next five years, according to the country’s mines ministry. Zimbabwe earned $2.47 billion from exports of minerals in the first half of 2018, according to central bank data, with platinum shipments generating $566.9 million.
PALLADIUM had its first down day in five yesterday, as the recent bull-run appears to have made a near-term peak at 1,150.86 last month. Speculative accounts turned net sellers for the first time in 10 weeks as price momentum stalled, according to the latest CFTC data.
Base metals
COPPER is currently enjoying a rebound from six-week lows but the uncertainty surrounding the US-China tariff war is damping sentiment and raising questions about global demand for the industrial metal going forward. This is evidenced by global PMIs retreating over the past two months. Copper is trading at 2.7219 today with the 100-day moving average acting as resistance at 2.8579.
Content is for general information purposes only. It is not investment advice or a solution to buy or sell securities. Opinions are the authors; not necessarily that of OANDA Business Information & Services, Inc. or any of its affiliates, subsidiaries, officers or directors. If you would like to reproduce or redistribute any of the content found on MarketPulse, an award winning forex, commodities and global indices analysis and news site service produced by OANDA Business Information & Services, Inc., please access the RSS feed or contact us at info@marketpulse.com. Visit https://www.marketpulse.com/ to find out more about the beat of the global markets. © 2023 OANDA Business Information & Services Inc.

Andrew Robinson
Latest posts by Andrew Robinson (see all)
- RBA cuts rates on virus impact - 2 March 2020
- Commodities Weekly: Oil rises first time in eight days - 2 March 2020
- Daily Markets Broadcast 2020-03-03 - 2 March 2020