China customs data for 2018 released yesterday highlighted declining demand for several commodities amid trade wars and as global demand slowed. A softer US dollar perked up precious metals, while a more-dovish Fed outlook bolstered energy prices.
NOTE: The US government shutdown has prevented the publication of the weekly Commitment of Traders report by CFTC
Energy
CRUDE OIL prices have seen a positive start to 2019 as promised production curbs by OPEC members and allies last year start to impact supply. West Texas Intermediate has risen more than 26% from the December low to last Friday’s near-term peak. That was the highest level since December 7.
Last week’s EIA inventory data showed a drawdown of 1.68 million barrels, less than analysts’ estimates of 2.8 million barrels, and the fifth reduction in inventories in six weeks. Despite the weak trade numbers in December, China’s crude imports were up 30% y/y in the month as refiners stockpiled ahead of the New Year and ensured that annual quotas were fully utilized, according to Reuters.
Saudi Arabia’s oil minister commented that oil markets will “return to balance” this year, noting that OPEC can do more to ensure this happens. The US also confirmed that it will offer no additional waivers on Iran imports, with the current waivers due to expire at the end of May.
Oil prices have traded below the 55-day moving average since October 17 and this average, now at $52.98, acts as the first technical hurdle for further gains.
WTI Daily Chart
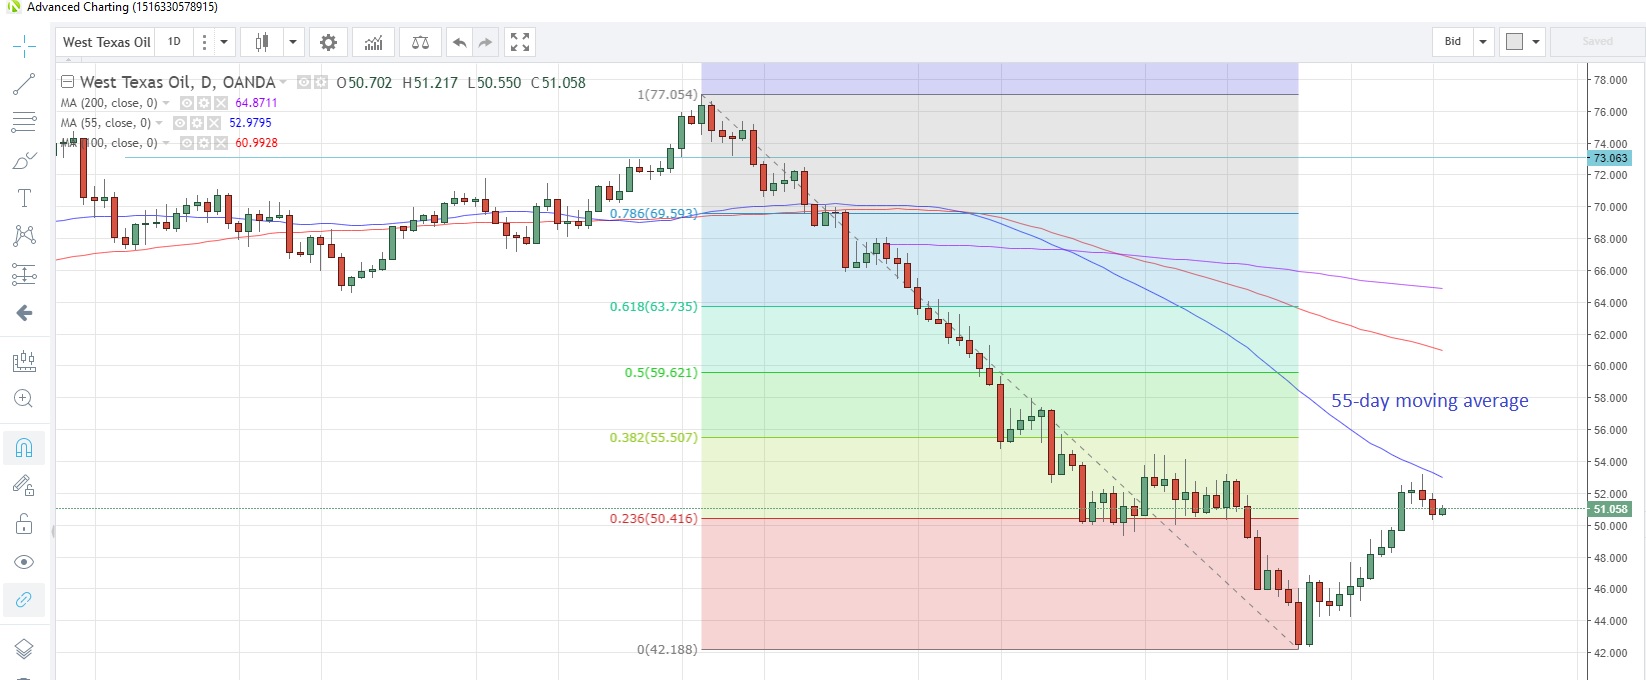
Source: OANDA fxTrade
China’s NATURAL GAS imports (either via pipeline or LNG) surged to record levels in 2018, making China the second-largest global importer behind Japan. Gas prices rose the most since late-November yesterday as a cold snap blankets the US Midwest. Prices have extended gains to a third day this morning, touching 3.706, the highest in three weeks. Natural gas is now at 3.668.
Precious metals
GOLD is benefiting from a more-dovish leaning on rates by the Fed since the start of the year, which in turn is pressuring the US dollar and rekindling gold’s bullish tone. Gold prices are up almost 12% from the 18-month low struck last August, with a marked acceleration of gains into the year-end.
In its 2019 outlook released on January 10, the World Gold Council reported that central banks continue to buy gold to diversify their reserves, with demand for gold in 2018 from that sector being the highest since 2015.
Newmont Mining Corp said on Monday it would buy smaller rival Goldcorp Inc for $10 billion, creating the world’s biggest gold producer.
SILVER is also enjoying the weaker US dollar environment, advancing to a seven-month high at the start of the year. In a research report released January 11, HSBC raised its 2019 average silver price forecast to $16.27 per ounce on the back of stronger investor demand, Reuters reported. The gold/silver (Mint) ratio is hovering above the 200-day moving average at 81.346 following one attempt at that support in the first week of the year.
Gold/Silver Daily Chart
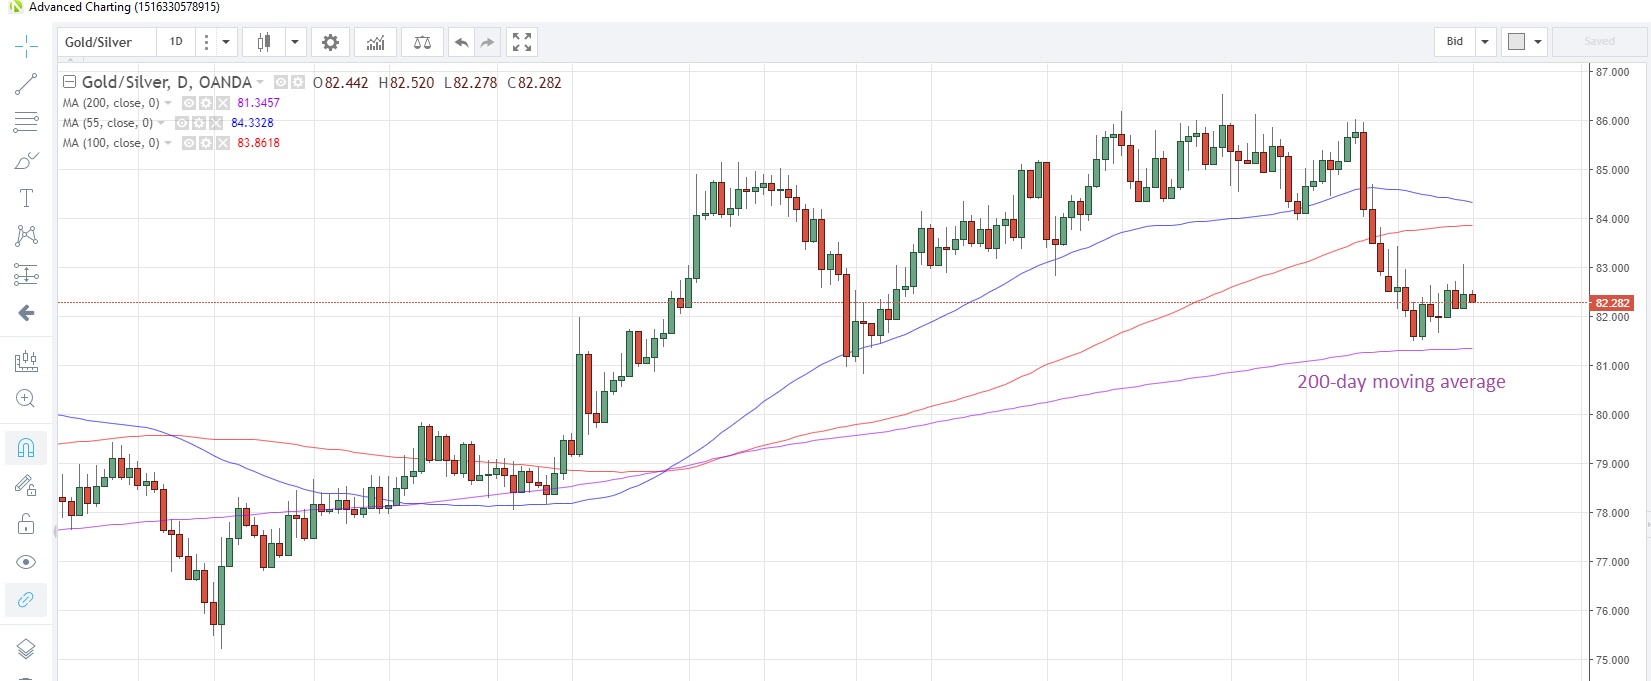
Source: OANDA fxTrade
PLATINUM is currently in the throes of retracing the strong up-move seen in the first four trading days of the year as profit-taking takes hold. The metal is still struggling from a global oversupply and remains below the 200-day moving average at 843.34, as it has since April last year.
Global supply may be affected as South Africa’s Association of Mineworkers and Construction Union (AMCU) said Monday it is planning to strike at Sibanye-Stillwater’s local platinum operations, expanding an earlier stoppage affecting its gold facilities.
PALLADIUM touched a new record high last week as commercial demand continued to grow. Prices touched 1,343.8 on January 9 and are still trading at a premium to gold, as they have done since January 4.
Base metals
Better trade relations between the US and China after the latest round of trade negotiations has tempered fears of a full-blown trade war and a deep slowdown in global growth. This has seen COPPER prices recover from 19-month lows seen at the start of the month. It’s now trading at 2.6355.
China’s copper imports rose 12.9% y/y to a record high in 2018, latest customs data out of China shows. Drivers behind the increase include China’s crackdown on the import of scrap copper in 2018 in an effort to control pollution. The crackdown is expected to continue in to 2019, with additional restrictions due to the introduced in July.
In contrast, China’s iron ore imports were down 1% from a year earlier, the first annual decline since 2010. Imports fell to 1.064 billion tonnes, but remained above the one billion tonne mark for the third straight year.
Agriculturals
SOYBEAN prices have risen since the start of the year as a result of thawing trade relations between the US and China. Last week negotiators met in Beijing and came out of the meeting with positive comments and vibes. China has announced soybean purchases after each of the last two meetings. China’s top trade negotiator is expected to visit to US to continue the discussions later this month.
In 2018, China’s soybean imports were down 7.9% y/y to 88.03 million tonnes, according to the latest customs data. Prices have made two attempts to breach the 200-day moving average over the last two months. Each one failed to sustain the up-move and subsequently gave back the gains. The moving average is now at 9.0162 with the current price at 8.9360.
Soybeans Daily Chart
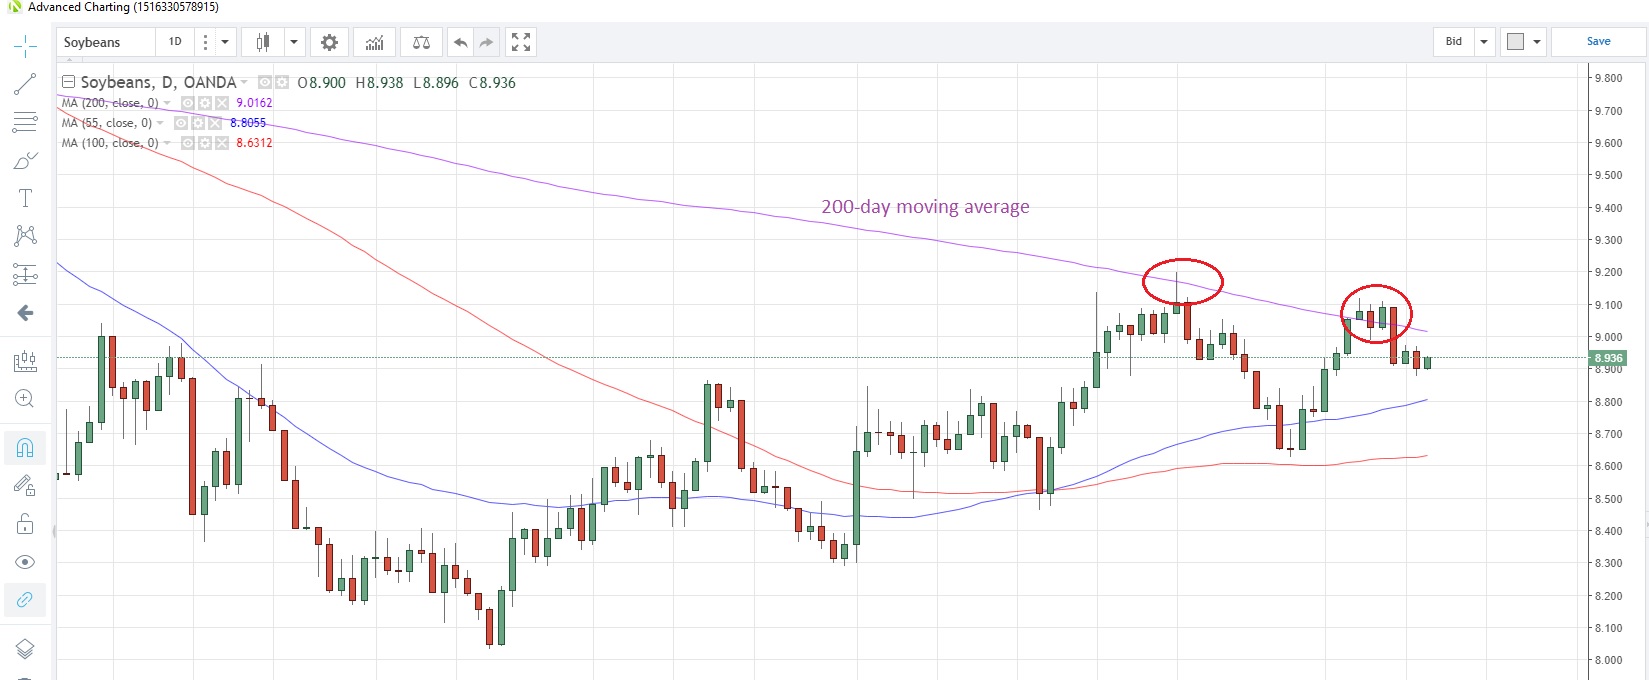
Source: OANDA fxTrade
WHEAT prices were given a boost amid concerns about waning supply out of Russia. Prices touched a four-week high of 5.127 last week and are currently consolidating at 5.059, above the convergent 55-, 100- and 200-day moving averages in the 4.9897 to 5.0106 window.
SUGAR traded near two-month highs last week, seemingly shrugging off Indonesia’s announcement that it intends to increase sugar output by 13% in 2019 and, as a result, may not need to tap international markets for sugar imports. Sugar is now at 0.12421, just below the November 29 high of 0.12587.
CORN is facing technical resistance in the 3.721-3.734 window, which represents monthly highs in December and January. It’s now at 3.715. The market would need more news of corn purchases from China as trade relations with the US thaw. Markets will also be keeping an eye on the weather in South America, with hot and dry weather seen in Brazil and excessive rains in Argentina, which could affect harvests.
Content is for general information purposes only. It is not investment advice or a solution to buy or sell securities. Opinions are the authors; not necessarily that of OANDA Business Information & Services, Inc. or any of its affiliates, subsidiaries, officers or directors. If you would like to reproduce or redistribute any of the content found on MarketPulse, an award winning forex, commodities and global indices analysis and news site service produced by OANDA Business Information & Services, Inc., please access the RSS feed or contact us at info@marketpulse.com. Visit https://www.marketpulse.com/ to find out more about the beat of the global markets. © 2023 OANDA Business Information & Services Inc.

Andrew Robinson
Latest posts by Andrew Robinson (see all)
- RBA cuts rates on virus impact - 2 March 2020
- Commodities Weekly: Oil rises first time in eight days - 2 March 2020
- Daily Markets Broadcast 2020-03-03 - 2 March 2020