Slower Chinese GDP growth in the fourth quarter and a resurgent US dollar have taken a bit of the shine off some commodities.
NOTE: The US government shutdown is still preventing the publication of the weekly Commitment of Traders report by CFTC. The latest published data is only at December 18.
Precious metals
GOLD appears to be marking time below the psychological $1,300 level as a slight rebound in the US dollar chips away at the upward momentum. It has been noted that in 2018 Russia diversified from US assets, trimming its holdings of US Treasuries and shifting into gold, after the US imposed sanctions on some Russian entities. The nation bought 8.8 million troy ounces of the precious metal, which meant it leapfrogged China to become the fifth largest gold holder globally behind the US, Germany, France and Italy.
From a technical perspective, the 55-day moving average moved above the 200-day moving average on January 17 for the first time since June 26. Support may be found at the 38.2% Fibonacci retracement of the November 13 to January 4 rally at 1,260.
Gold Daily Chart

Source: OANDA fxTrade
SILVER is also falling victim to the US dollar’s near-term resurgence, and is currently retesting 200-DMA support at 15.33 after breaking above this moving average on December 28. The gold/silver (Mint) ratio snapped a four-day winning streak yesterday after earlier touching the highest level in 3-1/2 weeks. The ratio is currently hovering near the 50% retracement level of the fall from December 26 to January 4 at 83.913.
PLATINUM is still bogged down by the issues of waning demand and oversupply. The metal is facing its third week of declines in a row and is sitting just about 5% above decade lows. However, in comments made last week in a Bloomberg interview, investment manager PIMCO said that it prefers platinum over gold, and highlights that it would require only a slight shift from gold ETFs into platinum ETFs by investors to change the dynamics. It classes platinum as “unloved and relatively cheap compared to other precious metals”. Platinum is currently at 795.40.
The reverse dynamics to platinum, rising demand and limited supply, are driving PALLADIUM’s extended surge to record highs. The precious metal rose above 1,400 for the first time ever last Thursday, peaking at 1,440 before edging lower on some profit-taking. It is trading at 1,396.95 today.
Base metals
COPPER fell the most since January 2 yesterday as weaker China growth data questioned future demand for the industrial metal. Copper failed again to sustain a break above the 100-day moving average at 2.7045, and retreated from five-week highs. It has remained below this moving average on a closing basis since December 17.
Energy
CRUDE OIL has been on a gradual uptrend since late-December, rising more than 22% from the December 24 low. West Texas Intermediate touched the highest since December 5 yesterday as investors focused on the impact of promised OPEC output reductions on supply. The softer China growth story appears to have had limited impact on perceived future demand for oil. The weekly API crude inventories data as at January 18 is due tomorrow, and could face the fourth consecutive weekly drawdown of stockpiles.
As well as OPEC’s cuts, latest data showed the US oil drilling rigs count slid to its lowest since May last year, the first decline since 2016, according to Reuters. However, China’s crude oil refinery throughput rose 6.8% from a year earlier to hit a record 603.5 million tonnes in 2018, according to China’s National Bureau of Statistics. This came despite 2018 GDP growth slowing to 6.6% for the year, the slowest in 28 years.
From a technical perspective, WTI breached the 55-day moving average last Friday for the first time since October 16. It completed a third straight weekly gain last week but so far appears to be struggling to maintain the upward momentum this week.
WTI Daily Chart
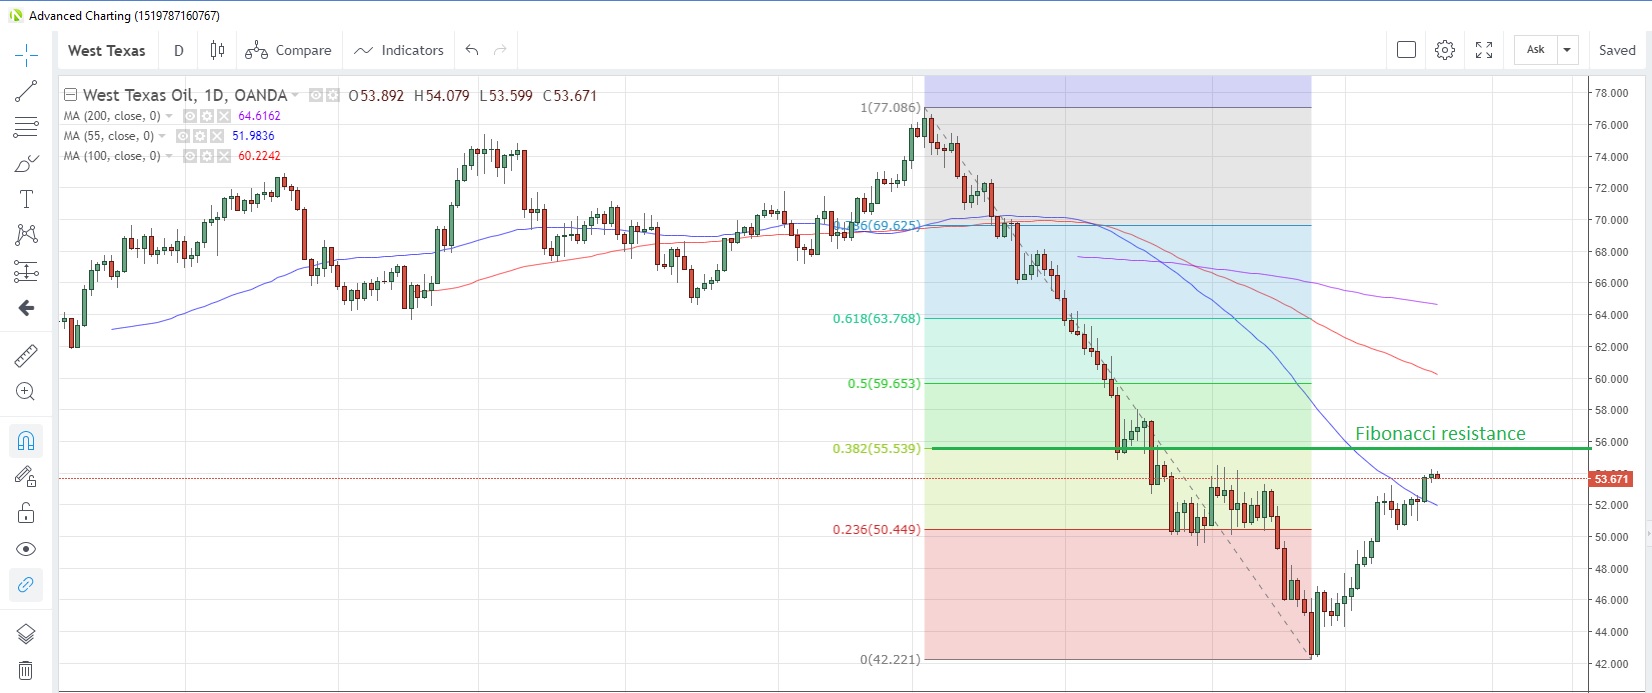
Source: OANDA fxTrade
China’s NATURAL GAS output increased 10% y/y in December to a record 15.3 billion cubic meters. This brought the total output for 2018 to 161 billion cubic meters, a gain of 7.5% from 2017. Gas prices could remain supported over the next couple of weeks as the cold weather snap that has struck the US Midwest is expected to persist into February. Weekly EIA storage data is due on Thursday and last week saw a reduction in stockpiles of 81 billion cubic meters, the ninth straight week of drawdowns.
Agriculturals
SUGAR is hovering near 2-1/2 month highs as some producers announce output cuts for the current season. India Sugar Mills Association, the leading industry body in that country, trimmed its 2018/19 sugar output forecast by 2.5% to 30.7 million tonnes, due to increased demand for ethanol from sugarcane. Meanwhile, Britain’s only company to produce sugar from local beets has scaled back its production estimates for 2019 to 1.15 million tonnes, a drop from 1.37m tonnes in the previous season, despite a higher sugar content from local beets. Sugar last traded at 0.12814.
WHEAT traders continue to be on weather-watch, with the cold weather across the US Midwest raising fears that as much as 15-20% of the soft red wheat crop could be at risk from sub-zero temperatures in late-January. Elsewhere, there is speculation that Russia’s state agriculture watchdog is planning to limit grain exports in the 2018/19 season that started last July 1, in order to keep a lid on domestic prices. Wheat is currently trading at 5.089.
SOYBEAN’s near-term direction will likely be dictated by developments in the US-China tariff negotiations, which are due to enter their next phase on January 30-31 when Chinese Vice Premier Liu visits Washington. Sentiment was given a boost when reports circulated last week that US Treasury Secretary Mnuchin was considering lifting tariffs ahead of the meeting, in order to enhance prospects of an agreement. Having suffered the most since the tariff war began, soybean prices are enjoying a revival on hopes of a solution. Wheat is at 9.040 today, and remains above the 100-day moving average, which has held on a closing basis since November 26.
Soybean Daily Chart
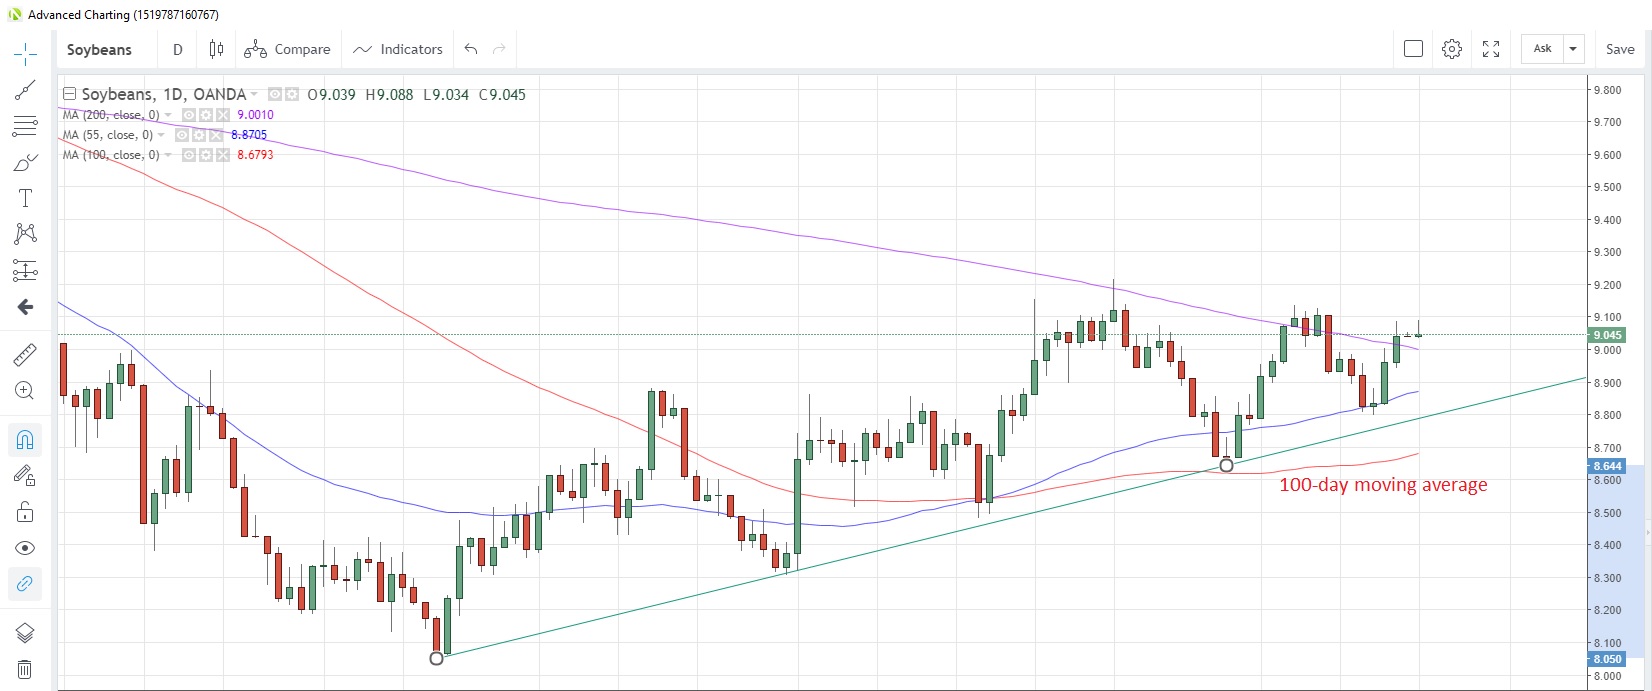
Source: OANDA fxTrade
CORN is hovering just below seven-month highs and appears to be struggling to gather impetus to take it above the 3.750 mark. This level has capped gains in both December and January, and corn has not closed above it since June 5. It’s currently sitting at 3.728.
Content is for general information purposes only. It is not investment advice or a solution to buy or sell securities. Opinions are the authors; not necessarily that of OANDA Business Information & Services, Inc. or any of its affiliates, subsidiaries, officers or directors. If you would like to reproduce or redistribute any of the content found on MarketPulse, an award winning forex, commodities and global indices analysis and news site service produced by OANDA Business Information & Services, Inc., please access the RSS feed or contact us at info@marketpulse.com. Visit https://www.marketpulse.com/ to find out more about the beat of the global markets. © 2023 OANDA Business Information & Services Inc.

Andrew Robinson
Latest posts by Andrew Robinson (see all)
- RBA cuts rates on virus impact - 2 March 2020
- Commodities Weekly: Oil rises first time in eight days - 2 March 2020
- Daily Markets Broadcast 2020-03-03 - 2 March 2020