Reported progress on the trade talks was generally not helpful for most commodities last week, with the agricultural sector surprisingly under increased pressure. Supply cuts continue to support oil prices, while safe havens under-performed.
Precious metals
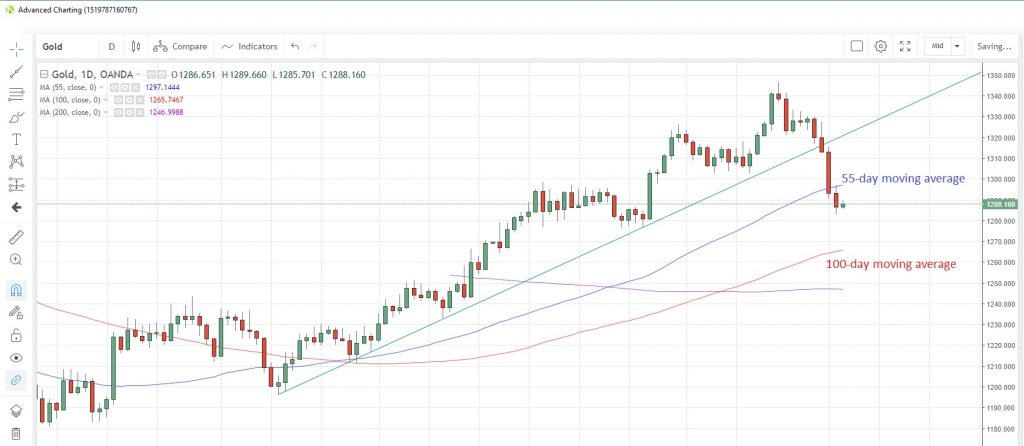
GOLD slid to the lowest since January 25 yesterday amid heightened speculation that the US and China were edging ever closer to a trade deal. Rumours suggested a deal may be agreed and signed off at a summit meeting between China’s Xi Jinping and US’ Trump around March 27. Progress has improved risk appetite and reduced investors’ need for safe-haven assets. Bloomberg reported earlier today that the world’s largest gold exchange-traded fund was seeing investor withdrawals at the fastest pace in more than a year, as the need for safe-haven assets diminishes.
It was announced that Australia’s gold production hit a record 317 million tons in 2018. It beat the previous record of 314.5 million tones set in 1997.
Speculative investors’ net long positions were at their highest since the week of April 17 last year, according to the latest data snapshot as of February 19 from CFTC. The precious metal posted its biggest weekly loss since May 2017 last week, closing below the 55-day moving average for the first time since November 13 last Friday. The 100-day moving average at 1,265.72 could be the next support point.
Gold Daily Chart
SILVER is also suffering from the increased risk appetite, falling to the lowest since December 27 yesterday. The metal is testing the 100-day moving average at 15.0563 and a break below would be the first time since December 17. Speculative investors reduced their net long positions for a second straight week, according to the latest CFTC data as at February 19.
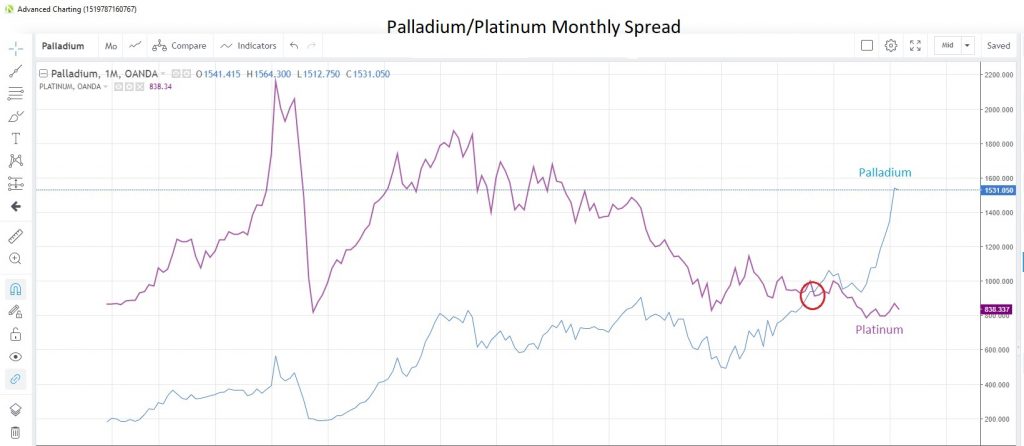
PALLADIUM continues to consolidate last week’s rally to record highs, falling slightly so far this month, which would be the first month in eight that it has lost ground. Speculative investors are still loading up bullish positions, adding to net longs for the third straight week in the week to February 19.
Goldman Sachs commented in a research note that the blow out in the palladium/platinum spread could prompt a switch to the cheaper metal in manufacturing, though as yet there are few signs of the substitution being made.
Record high palladium prices has also increased interest in recycling or reclaiming any used metal. A report shows that in the first 10 months of 2018, 3.2 million ounces of used palladium had been reclaimed. That’s an 11% increase from a year earlier and more than mined palladium during the period.
Palladium/Platinum Spread – Monthly Chart
PLATINUM has had a negative month so far as news that a planned strike by miners in South Africa had been delayed as the courts reserved judgement on whether to block a week-long strike scheduled for Thursday. The lack of a disruption to supplies pressured platinum prices to 835.40, the lowest in 11 days.
Base metals
COPPER suffered its first weekly loss in eight weeks last week, despite positive news on the trade talk front. The industrial metal appears on track to snap a three-day losing streak with gains of 0.5% so far today. Speculative investors turned net bullish again in the latest week of data to February 19 after turning negative the previous week.
A planned expansion at one of the world’s biggest mines in Mongolia has been pushed back to past 2020 due to weak prices and slackening demand. Copper inventories at warehouses tracked by the London Metal Exchange rose for a second straight day yesterday, after reaching the lowest levels seen since the 1970s, Bloomberg reported.
Energy
CRUDE OIL prices rebounded yesterday as Russia announce it was to speed up its production cuts this month. This comes hot on the heels of data that showed OPEC production hit a four-year low in February, and implies that a supply-side squeeze could continue to help support prices. Data also showed that the number of online US rigs fell to the lowest since early-May last year.
West Texas Intermediate has been hovering around the 100-day moving average, which is at $55.09 today, for the past two weeks, while the 55-day moving average at 51.985 has supported prices on a closing basis since January 17.
NATURAL GAS continues to recover from 14-month lows, posting its second weekly advance in a row last week. Gas storage fell 166 billion cubic feet in the week to February 22, and is currently 22% below the five-year average, according to Bloomberg calculations.
Natural gas is now at 2.847, with the next potential resistance point at the 55-day moving average of 3.0332. Net non-commercial futures positions are most bearish since the week of September 25, according to data from CFTC as at February 19.
The cold weather snap that has gripped the US east coast is expected to moderate, potentially reducing demand for natural gas.
Agriculturals
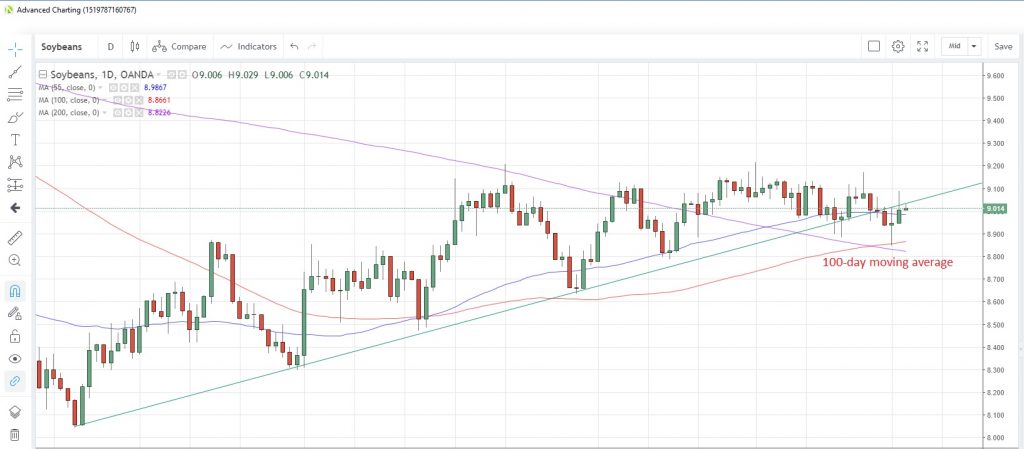
SOYBEAN prices are recovering from 6-1/2 week lows amid expectations that at US-China trade deal is getting close. Supply-side issues are also surfacing, with rains in Brazil interrupting harvests and questioning the quality of the output. That said, Brazil’s exports were 113% higher in February than a year earlier. Speculative investors were net sellers for a third consecutive week with overall net shorts at the highest since the week of November 27, according to the latest data from CFTC as at February 19.
Support at the 100-day moving average at 8.866 survived the recent test on a closing basis and has now supported prices since November 26.
Soybeans Daily Chart
WHEAT could potentially post its first up-day in eight days as it rebounds from an 11-month low after suffering the biggest weekly loss since August last week. Positive developments on the trade war front could help sentiment, though since February 13, prices have only managed one positive session out of 12. Speculative net short positions were at the highest in a year, latest data from CFTC to February 19 showed. A stronger rebound in prices may see some profit-taking take hold. Wheat is now at 4.480.
India revised its 2017-18 wheat production upwards to 99.12 million tons from 97.11 million tons at the first estimate. Meanwhile Russia confirmed that its final production total in 2018 was 72.1 million tons.
SUGAR prices have also been under pressure, falling for a third straight day yesterday, as they suffer from an overall supply glut on global markets. Prices closed below the 55-day moving average yesterday, the first time since January 4, but held above the 100-day moving average. This average is at 0.1241 today and has supported prices for almost two months.
CORN experienced the biggest weekly loss since September last week, despite the speculation surrounding the trade negotiations. Speculative investors appear to be throwing in the towel on bullish bets, as net longs were pared back to the lowest since September 25, according to the latest CFTC data. Although prices tested below the 100- and 200-week moving averages at 3.5997 and 3.6066, respectively last week, the commodity managed to close above them, so they remain intact. Corn closed at 3.648 yesterday.
Content is for general information purposes only. It is not investment advice or a solution to buy or sell securities. Opinions are the authors; not necessarily that of OANDA Business Information & Services, Inc. or any of its affiliates, subsidiaries, officers or directors. If you would like to reproduce or redistribute any of the content found on MarketPulse, an award winning forex, commodities and global indices analysis and news site service produced by OANDA Business Information & Services, Inc., please access the RSS feed or contact us at info@marketpulse.com. Visit https://www.marketpulse.com/ to find out more about the beat of the global markets. © 2023 OANDA Business Information & Services Inc.


