$1,280 vulnerable if gold fails to break March peak
We’re seeing some profit taking in gold early in the day on Thursday, with the yellow metal coming on the back of four winning days in the last five. That’s an impressive run of form considering only a week ago we were seeing $1,280 – which is increasingly becoming an important support area – being tested by sellers only for it to be successfully defended once again.
Gold bulls should put the celebrations on hold though because we’ve now fallen short of the previous peak for a second time since it topped out in mid-February. That’s not to say we won’t see another run at it in the coming sessions but a failure to break through the March peak – around $1,325 – may reinvigorate the sellers and see $1,280 quickly come under pressure again.
Gold Daily Chart
OANDA fxTrade Advanced Charting Platform
Of course, the dollar could have a key role to play and at the moment it is trading close to multi-month highs. A break higher could put $1,280 under considerable pressure. How many tests will gold bulls hang around for?
That’s often the question that’s asked. If bulls are holding on and seeing repeated challenges, does it dent their confidence and what happens when some start to flee. To make matters worse, if the level is broken, could this trigger a bunch of stops – both real and intended – and exacerbate the move to the downside? We may soon see.
Markets continue to kick the can down the road
Of course, there is the train of thought that suggests each hold is a sign of strength and there is certainly a case for that. What can case doubt though is when rebounds are being sold into earlier and this looks to be happening in the case of gold. And today’s declines are doing little to alleviate such concerns.
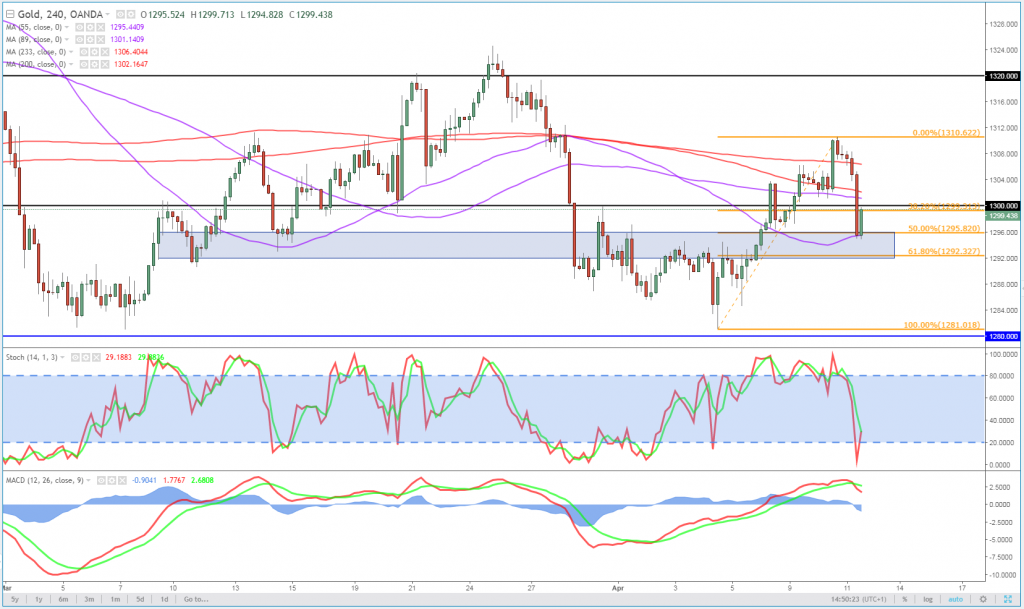
Gold 4-Hour Chart
A look at the 4-hour chart may suggest that the area around $1,292-1,296 may offer some insight into whether we could see another run at $1,280. This area roughly covers the ground between the 50 and 61.8 Fibonacci retracement levels but also coincides with prior support and resistance. A break of this may be a bearish near-term signal.
Content is for general information purposes only. It is not investment advice or a solution to buy or sell securities. Opinions are the authors; not necessarily that of OANDA Business Information & Services, Inc. or any of its affiliates, subsidiaries, officers or directors. If you would like to reproduce or redistribute any of the content found on MarketPulse, an award winning forex, commodities and global indices analysis and news site service produced by OANDA Business Information & Services, Inc., please access the RSS feed or contact us at info@marketpulse.com. Visit https://www.marketpulse.com/ to find out more about the beat of the global markets. © 2023 OANDA Business Information & Services Inc.


