- An increase in dovish expectations on a rapid pace of Fed funds rate cuts projected for 2024 indicates a potential impending recession.
- An uptick in recession risk may see a further deterioration in the US 10-year Treasury real yield which reduces the opportunity costs for holding Spot Gold (XAU/USD).
- Spot Gold (XAU/USD) has managed to trade back above its 20-day moving average.
This is a follow-up analysis of our prior report, “Gold Technical: Extension of corrective decline ahead of FOMC” published on 11 December 2023. Click here for a recap.
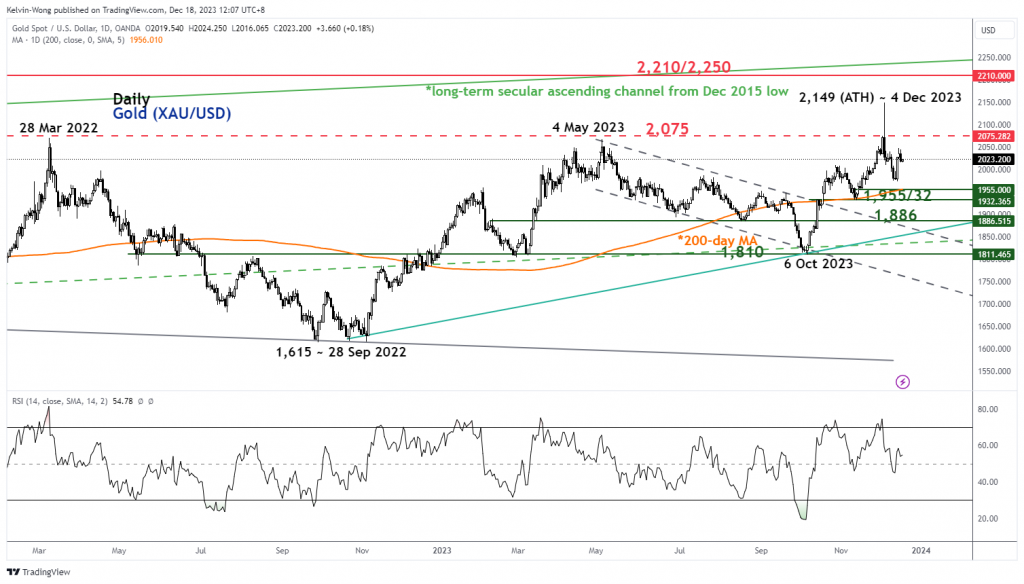
The price actions of Spot Gold (XAU/USD) have shaped the extended corrective decline to print an intraday low of US$1,973 on 13 December during the European session ahead of the FOMC meeting announcement on the same day which was just a whisker away from the US$1,955 support highlighted in our previous analysis.
All in all, it has shed -8.2% from its current all-time high of US$2,149 printed on 4 December 2023 which represents a retracement of close to 50% of its ongoing medium-term uptrend phase in place since the 6 October 2023 low of US$1,810.
The US Federal Reserve unleashed its dovish pivot last Wednesday, 13 December where its latest “dot plot” projection for the trajectory of the Fed funds rate has indicated a total of three rate cuts (75 basis points) pencilled in for 2024, upped from two projected rate cuts in the prior September’s dot plot which in turn led to an increased in dovish expectations of market participants to price in six rate cuts, a total of 150 bps in 2024 via the 30-day Fed funds rate futures calculated by the CME FedWatch tool.
This kind of dovish expectation that has skewed towards a rapid pace of the Fed funds rate cuts projection in the upcoming monetary easing cycle seems to indicate an impending recessionary scenario in 2024 that may put further downside pressure on the US 10-year Treasury real yield.
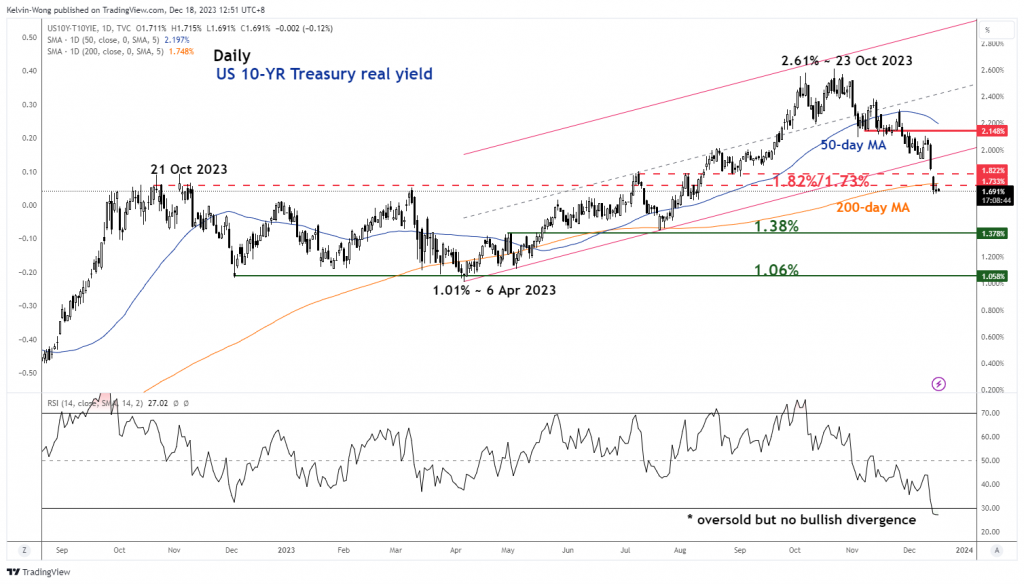
US 10-year Treasury real yield broke below the 200-day moving average
Fig 1: US 10-year Treasury real yield medium-term trend as of 18 Dec 2023 (Source: TradingView, click to enlarge chart)
The price movement of the US 10-year Treasury real yield has broken down below a major support zone of 1.82%/1.73% (also the 200-day moving average) which room for further downside potential with the next intermediate support coming in at 1.38%.
Based on intermarket analysis, a further deterioration in the US 10-year Treasury real yield may support another round of potential impulsive upmove sequence in gold prices due to lower opportunity costs as gold does not produce “fixed coupons income streams” like bonds.
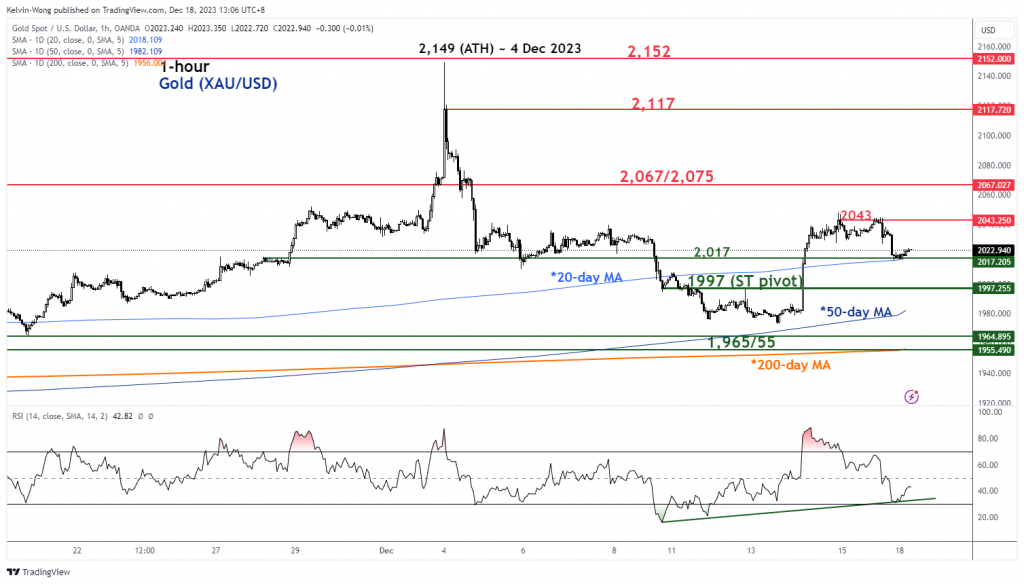
Watch the US$1,997 key short-term support
Fig 2: Spot Gold (XAU/USD) medium-term trend as of 18 Dec 2023 (Source: TradingView, click to enlarge chart)
Fig 3: Spot Gold (XAU/USD) minor short-term trend as of 18 Dec 2023 (Source: TradingView, click to enlarge chart)
The minor slide of -1.5% seen Spot Gold (XAU/USD) from Thursday, 14 December ex-post FOMC high of US$2,048 has been accompanied by a hawkish remark made by Fed official Williams last Friday, 15 December that indicated a lack of preference for FOMC to discuss its first rate cut in March 2024 which was in contrast with a high chance of 75% of a 25 bps rate cut in March 2024 FOMC as priced in by the 30-day Fed funds futures calculated by the CME FedWatch tool as of 15 December 2023.
Interestingly, the slide has managed to stall right at the upward-sloping 20-day moving average, acting as near-term support at US$2,017, slightly above the US$1,997 short-term pivotal support with a bullish momentum reading seen in the hourly RSI momentum indicator at its oversold region.
A clearance above US$2,043 may see the next intermediate resistances coming at US$2,067/US$2,075 and US$2,117 in the first step.
However, failure to hold at US$1,997 invalidates the recovery scenario to revive the corrective decline towards the medium-term support zone at US$1,965/US$1,955 (also the 200-day moving average).
Content is for general information purposes only. It is not investment advice or a solution to buy or sell securities. Opinions are the authors; not necessarily that of OANDA Business Information & Services, Inc. or any of its affiliates, subsidiaries, officers or directors. If you would like to reproduce or redistribute any of the content found on MarketPulse, an award winning forex, commodities and global indices analysis and news site service produced by OANDA Business Information & Services, Inc., please access the RSS feed or contact us at info@marketpulse.com. Visit https://www.marketpulse.com/ to find out more about the beat of the global markets. © 2023 OANDA Business Information & Services Inc.


