- Gold prices hover around $2500/oz as the DXY strengthens, with markets awaiting key data amidst geopolitical tensions.
- Gold ETFs see continued inflows, marking a fourth consecutive month of gains, signaling sustained investor interest.
- Technical analysis reveals a bearish triangle pattern on the Gold chart, suggesting a potential price decline.
Most Read: S&P 500, Nasdaq 100 – Caution Reigns Ahead of Nvidia Earnings
Gold prices have returned to $2500/oz as the DXY started the day strong. Geopolitical tensions have taken a backseat while markets anticipate this week’s data. Gold ETFs experienced modest inflows last week, continuing a trend that began in May, with inflows totaling around 8 metric tonnes ($403 million), setting the stage for a fourth consecutive month of growth.
Market participants are closely watching Nvidia’s earnings release later today, which could spark volatility and influence broader markets. Additionally, the upcoming PCE data on Friday could be pivotal in determining gold’s trajectory by the week’s end.
The rally in the US Dollar this morning could be attributed to various factors, including end-of-month re balancing by investors. With expectations of 100 bps in rate cuts, the question arises: Have these cuts already been priced into the market?
US Dollar Index Daily Chart, August 28, 2024
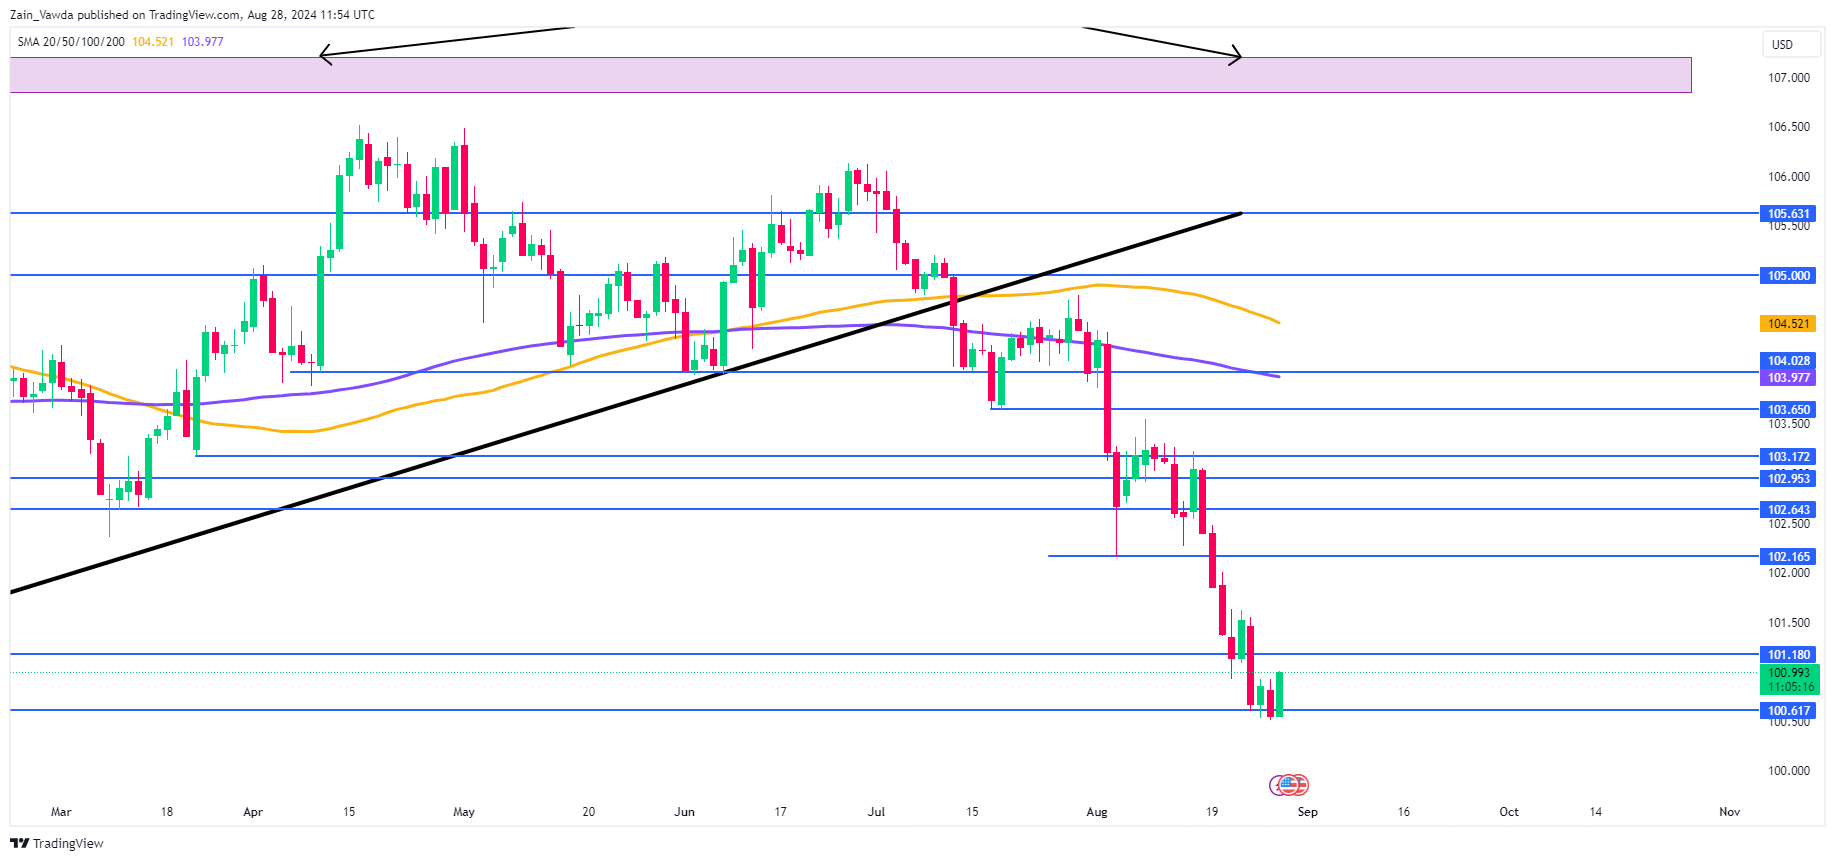
Source:TradingView
On the data front, it’s another quiet day for US economic data with the highlight being comments from Federal Reserve policymaker Rafael Bostic. It will be interesting to gauge where the Atlanta Fed President stands regarding a potential 50 bps rate cut in September.
Any hint that Bostic is in favor of a 50 bps cut could add to the dollar’s woes and likely lead to a renewed selloff. Whether this will last however remains to be seen given the US data on Thursday and Friday.
For all market-moving economic releases and events, see the MarketPulse Economic Calendar.
Technical Analysis Gold (XAU/USD)
From a technical perspective, the four-hour Gold chart is currently noteworthy. During the US session yesterday, Gold surged close to its all-time high and appeared set to climb further overnight as the Dollar Index weakened.
However, this morning witnessed a rebound in the US Dollar, which has contributed to a $30 decline in Gold prices, bringing them back to the $2500/oz level.
The H4 chart reveals an intriguing triangle pattern that has decisively broken to the downside. This breakout suggests a potential $60-$70 decline in gold prices, targeting support near the $2440/oz mark according to the pattern’s guideline.
Nonetheless, geopolitical risks remain a concern, as previous technical patterns have failed to manifest as expected for this precious metal. Will this instance prove to be different?
GOLD (XAU/USD) Four-Hour (H4) Chart, August 28, 2024
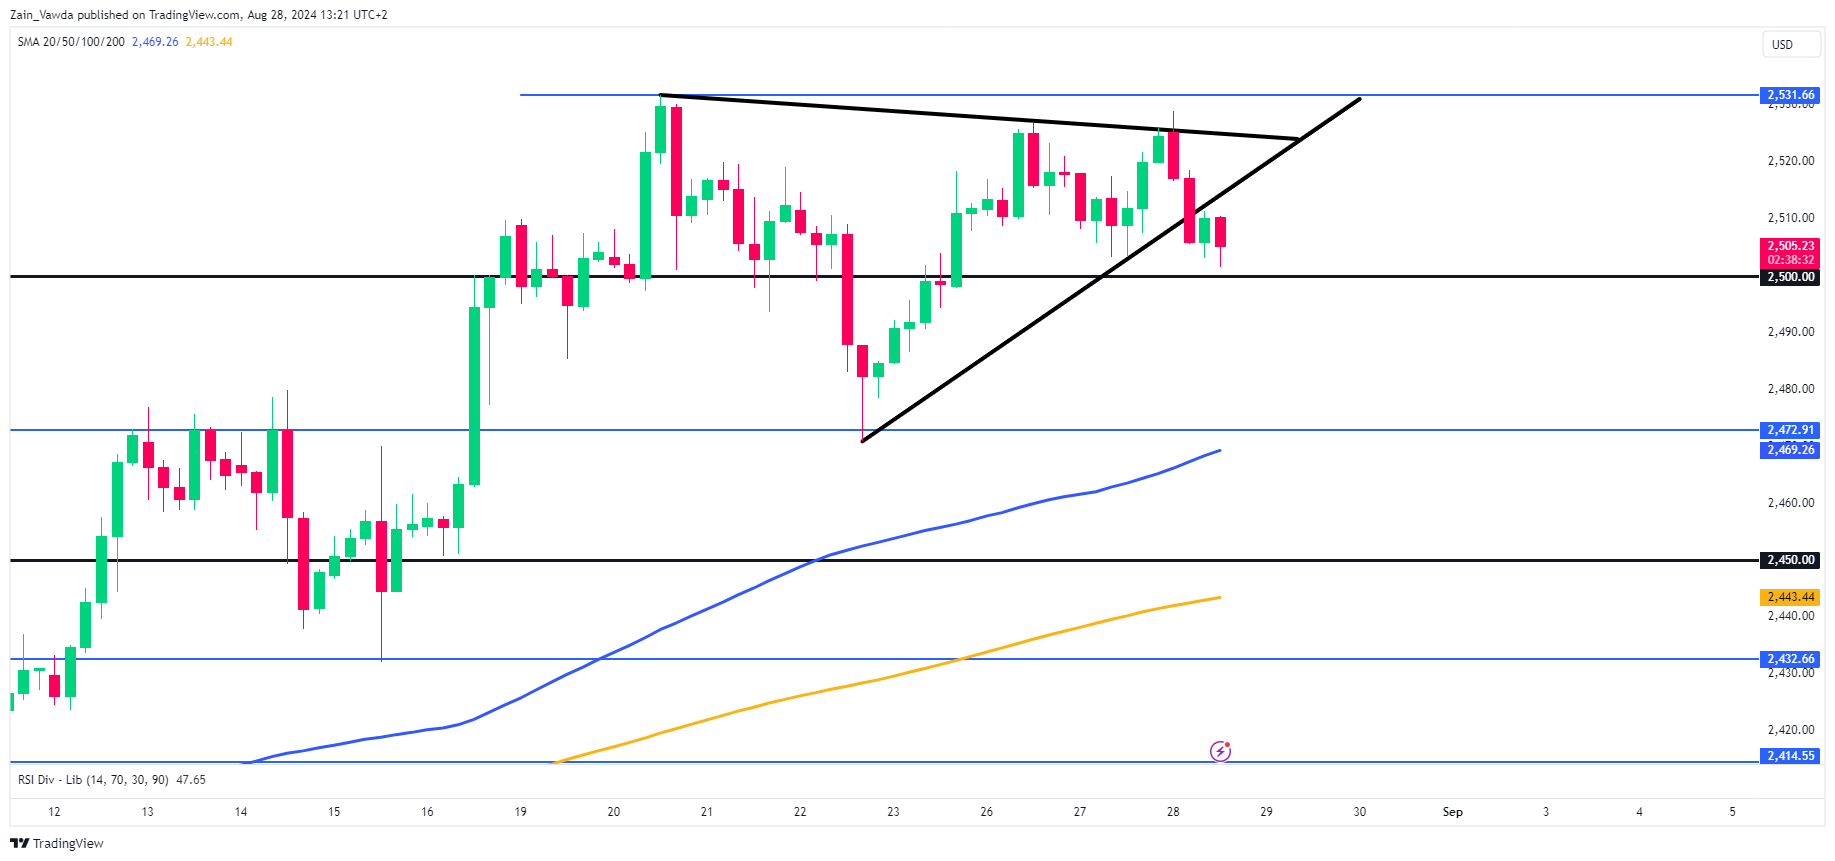
Source: TradingView (click to enlarge)
Support
- 2484
- 2472
- 2450
Resistance
- 2514
- 2531.66
- 2550
Follow Zain on Twitter/X for Additional Market News and Insights @zvawda
Content is for general information purposes only. It is not investment advice or a solution to buy or sell securities. Opinions are the authors; not necessarily that of OANDA Business Information & Services, Inc. or any of its affiliates, subsidiaries, officers or directors. If you would like to reproduce or redistribute any of the content found on MarketPulse, an award winning forex, commodities and global indices analysis and news site service produced by OANDA Business Information & Services, Inc., please access the RSS feed or contact us at info@marketpulse.com. Visit https://www.marketpulse.com/ to find out more about the beat of the global markets. © 2023 OANDA Business Information & Services Inc.

Zain Vawda
He has spent the last 3 years in an analyst role honing his skills across various financial domains, including technical analysis, economic data interpretation, price action strategies, and analyzing the geopolitical impacts on global markets. Currently, Zain is advancing in obtaining his Capital Markets & Security Analyst (CMSA) designation through the Corporate Finance Institute (CFI), where he has completed modules in fixed income fundamentals, portfolio management fundamentals, equity market fundamentals, introduction to capital markets, and derivative fundamentals.
He is also a regular guest on radio and television programs in South Africa, providing insight into global markets and the economy. Additionally, he has contributed to the development of a financial markets course approved by BankSeta (Banking Sector Education and Training Authority) at NQF level 6 in South Africa.