Gold for Tuesday, April 28, 2015
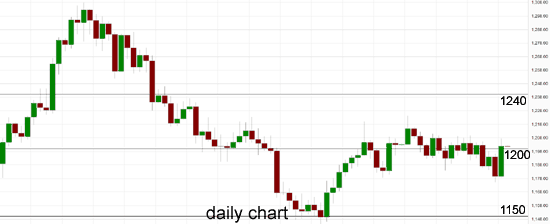
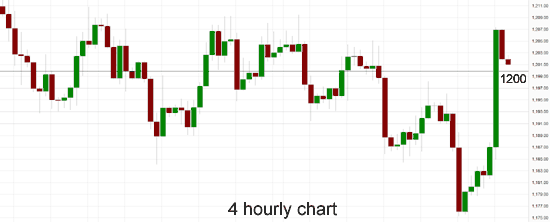
Gold is consolidating after its recent surge higher to return to the key $1200 level which is where it stopped. To start this new week Gold was trying to rally higher and regain lost ground from the end of last week which saw it drop to near $1175. The support at $1180 has done well to keep it propped up. In the last couple of weeks, gold has traded in a narrow range right around the key $1200 level and this range had been getting tighter, although to close out last week it drifted lower and fell to a one month low. Gold has had an attraction to the key $1200 level as every time it ventures away it returns quickly to trade right around it. Several weeks ago gold sprung to life surging higher away from the key $1200 level back to a seven week high above $1220 before easing back and finding some support at the key $1200 level. Back at end of March gold eased a little for a few days to below $1185, although for the best part of the last few weeks gold has moved strongly off the support at $1150 and then found some new support from the $1200 level.
Throughout the second half of February gold enjoyed rock solid support from the key $1200 level which held it up on numerous occasions. For about a month gold drifted steadily lower down to a one month low near the key $1200 level before finding the solid support at this key level. At the beginning of December gold eased lower away from the resistance level at $1240 yet again back down to below $1200. During the second half of November gold made repeated runs at the resistance level at $1200 failing every time, before finally breaking through strongly. Throughout the first half of November Gold enjoyed a strong resurgence back to the key $1200 level where it has met stiff resistance up until recently.
Throughout the second half of October gold fell very strongly and resumed the medium term down trend falling from above $1250 back down through the key $1240 level, down below $1200 to a multi year low near $1130. It spent a few days consolidating around $1160 after the strong fall which has allowed it to rally higher in the last couple of weeks. Earlier in October Gold ran into the previous key level at $1240, however it also managed to surge higher to a five week high at $1255. In late August Gold enjoyed a resurgence as it moved strongly higher off the support level at $1275, however it then ran into resistance at $1290. In the week prior, Gold had been falling lower back towards the medium term support level at $1290 however to finish out last week it fell sharply down to the previous key level at $1275.
Gold on Monday saw its biggest one-day rise since January as some dealers scrambled to cover short positions and the May options expiry triggered more buying. U.S. gold futures for June delivery settled up 2.4 percent, its best percentage jump since January 15, at $1,203.20 an ounce. Meanwhile, spot gold rose 2.1 percent to $1,204 an ounce. On Friday spot prices slipped as low as $1,174.73 an ounce. “It’s quite undervalued and we’ve had a long period of consolidation around the $1,200 mark,” said Mark O’Byrne, research director of bullion dealer GoldCore, noting that the breach of the $1,200 level spurred additional technical buying. O’Byrne said that while there were several factors spurring the session’s rally, short-covering could be the primary driver. Options-related buying also buoyed prices with U.S. May options set to expire at the end of the day with relatively heavy open interest at the $1,200 strike price, traders said.
(Daily chart / 4 hourly chart below)
Gold April 28 at 00:40 GMT 1201.3 H: 1207.3 L: 1178.7
Gold Technical
| S3 | S2 | S1 | R1 | R2 | R3 |
| 1180 | 1150 | — | 1240 | 1300 | — |
During the early hours of the Asian trading session on Tuesday, Gold is consolidating after its recent surge higher to return to the key $1200 level. Current range: trading above $1200.
Further levels in both directions:
• Below: 1180 and 1150.
• Above: 1240 and 1300.
OANDA’s Open Position Ratios
(Shows the ratio of long vs. short positions held for Gold among all OANDA clients. The left percentage (blue) shows long positions; the right percentage (orange) shows short positions.)
The long position ratio for Gold has moved back to near 60% as surged back to the key $1200 level. The trader sentiment is in favour of long positions.
Economic Releases
- 06:00 UK Nationwide House Prices (28th-2nd) (Apr)
- 08:30 UK BBA Mortgage Approvals (Mar)
- 08:30 UK GDP (1st Est.) (Q1)
- 08:30 UK Index of Services (Feb)
- 13:00 US S&P Case-Shiller Home Price (Feb)
- 14:00 US Consumer Confidence (Apr)
- US Federal Reserve FOMC meeting (to 29th)
* All release times are GMT
This article is for general information purposes only. It is not investment advice or a solution to buy or sell securities. Opinions are the authors; not necessarily that of OANDA Corporation or any of its affiliates, subsidiaries, officers or directors. Leveraged trading is high risk and not suitable for all. You could lose all of your deposited funds.


