Gold – Friday 19 June 2015
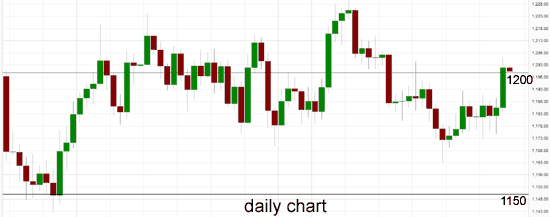
In recent hours gold is easing back to the key $1200 level after recently surging higher to a three week high above $1205. The $1200 level remains significant and is likely to continue to place selling pressure on gold. Prior to the surge and in the last couple of weeks gold has been content to trade around the key $1180 level. During last week it rallied well to move from a two month low near $1160 back up to above $1190 again before easing back to the $1180 level. The key $1180 level has consistently provided solid support and has held it up now for a couple of months, with the recent exception. A few weeks ago gold fell sharply back through the key $1200 level and spent the remainder of that week consolidating in a narrow range around $1190.
The $1200 level has been a significant level throughout most of this year and remains a key level presently offering reasonable resistance to higher prices, whilst lower the $1180 level continues to be significant. Throughout the last month or so the $1180 level has provided some support and has been called upon recently. Earlier in May it was able to make a run through the $1200 level to reach a three month high above $1230 however gold was quickly sold off and returned back to the $1200 level where it enjoyed some support for several days.
For around two months through April gold traded in a range between $1180 and around $1220 and had very few excursions outside these limits. Gold is currently pinned between resistance at $1200 and support at $1180 and it is surprising to see it trade in such a narrow range for several days. It seems it is waiting patiently for external factors to determine which level will be severely tested next.
(Daily chart / 4 hourly chart below)
Gold June 19 at 01:05 GMT 1200.3 H: 1205.9 L: 1183.7
Gold Technical
| S3 | S2 | S1 | R1 | R2 | R3 |
| 1180 | 1150 | — | 1200 | 1240 | — |
During the early hours of the Asian trading session on Friday, Gold is easing back to the key $1200 level after recently surging higher to a three week high above $1205. Current range: trading right around $1200.
Further levels in both directions:
• Below: 1180 and 1150.
• Above: 1200 and 1240.
OANDA’s Open Position Ratios
(Shows the ratio of long vs. short positions held for Gold among all OANDA clients. The left percentage (blue) shows long positions; the right percentage (orange) shows short positions.)
The long position ratio for Gold has dropped back below 70% as Gold has surged back to the key $1200 level. The trader sentiment is strongly in favour of long positions.
Economic Releases
- 03:00 JP BoJ Policy Statement and Governor Kuroda Press Conference
- 04:30 JP All Industry activity index (Apr)
- 05:00 JP Leading indicator (Final) (Apr)
- 07:00 EU EU Finance Ministers Hold Meeting in Brussels
- 08:00 EU Current Account (sa) (Apr)
- 08:30 UK Public Borrowing (PSNB ex banks) (May)
- 10:00 UK CBI Industrial Trends (19th-23rd) (Jun)
- 12:30 CA CPI (May)
- 12:30 CA Retail Sales (Apr)
- JP BoJ MPC – Overnight Rate
* All release times are GMT
This article is for general information purposes only. It is not investment advice or a solution to buy or sell securities. Opinions are the authors; not necessarily that of OANDA Corporation or any of its affiliates, subsidiaries, officers or directors. Leveraged trading is high risk and not suitable for all. You could lose all of your deposited funds.


