Gold has been the biggest beneficiary from recent sharp stock sell-off, as traders clear their equities and higher risk assets in search of safe havens such as Gold. Why they still consider Gold a safe haven after the 2013 rout is interesting, but such discussion is moot as there is no denying that prices are indeed higher and look set to push even higher as the US risk off contagion spreads to Asia and now Europe.
Hourly Chart
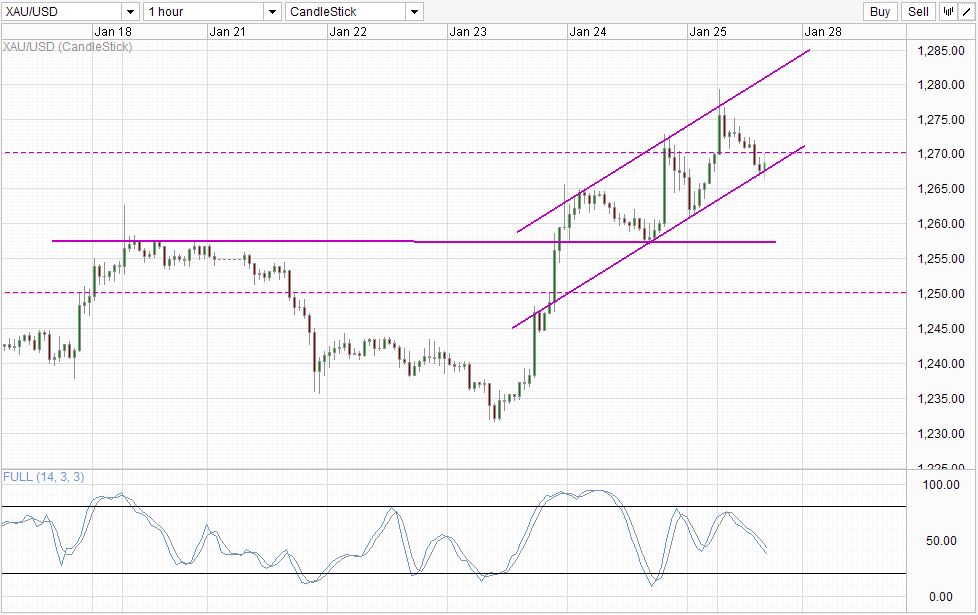
That being said, it wasn’t a smooth journey for Gold from the recent low of 1,231.5 to 1,279. Prices have pulled back lower on 3 separate occasions, with the timing of the pullback peculiar as the decline not matching that of S&P 500 – the proxy for risk appetite. Hence, the decline in Gold can only be explained by way of Technical influences (which is reasonable considering that a new Channel has seen been formed, with a hint of suspicion that Gold bears are still lurking around. The latter portion of the previous assertion make sense as well when we consider that the reasons for treating Gold as a “safe haven asset” right now seem to be thin, given that Gold still remain much higher compared to pre stimulus days (e.g. circa 2007). As such, even though momentum is clearly on the upside right now, do not be surprised to see strong bearish winds ahead.
Right now, price has just rebounded off Channel Bottom, with potential for bullish acceleration towards Channel Top if 1,270 is broken. Stochastic readings is still pointing lower though, but it is possible that Stoch curve will be able to rebound from here higher given that it is sitting on the “support level” seen from the previous trough on Friday. The failure to break 1,270 increases the likelihood of price breaking Channel Bottom, we could see bearish acceleration towards 1,257 – and the bullish momentum will be negated.
Daily Chart
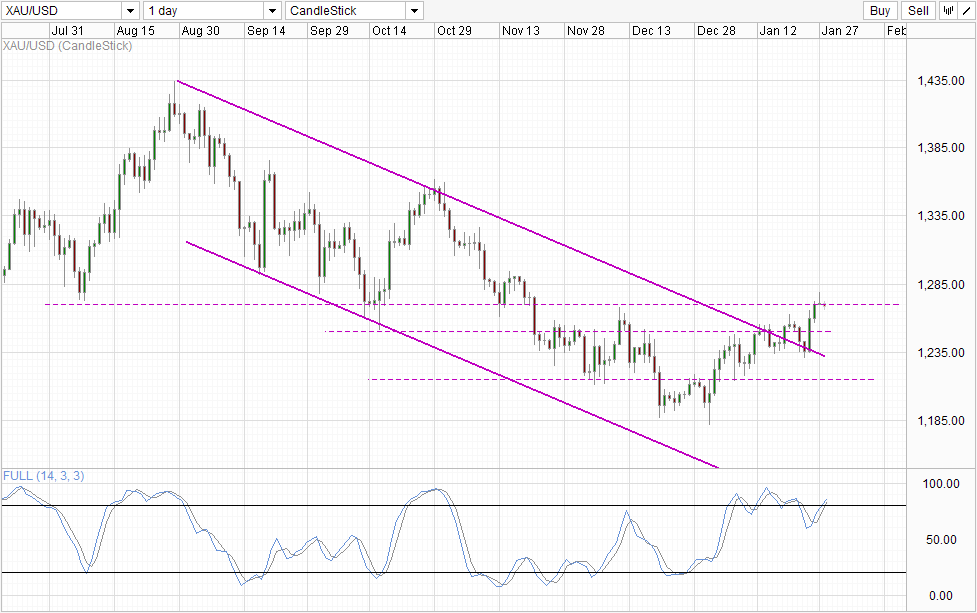
Daily Chart support the bearish outlook as well. If prices fail to conquer 1,270, and short-term momentum does push lower, then we could be seeing an Evening Star pattern forming, opening up a move towards 1,250 and 1,215 if the bullish momentum from 1st Jan has been invalidated. Stochastic on Daily Chart agrees, with Stoch readings currently within the Overbought region. However, it should be noted that previous Evening Star signal seen on 21st Jan has failed to gain bearish traction, while Stoch curve has only just recently rebuffed a fresh bearish cycle signal. Hence, traders should not underestimate the power of bullish momentum even though fundamental reasons for Gold to rally beyond short-term knee-jerk risk aversion flows.
More Links:
Week In FX Americas – The Loonies’ Week from Hell
Week in FX Europe – Contagion, contagion, contagion!
Week in FX Asia – China Manufacturing Disappoints as Emerging Markets Drop
This article is for general information purposes only. It is not investment advice or a solution to buy or sell securities. Opinions are the authors; not necessarily that of OANDA Corporation or any of its affiliates, subsidiaries, officers or directors. Leveraged trading is high risk and not suitable for all. You could lose all of your deposited funds.


