It is very strange seeing Gold prices crossing the 1,300 mark. According to most analyst expectations, Gold should be trading lower and not higher as there is less need for the yellow metal as global economy start to recover. Need for inflation protection is also lower now given that US has already started tapering and is expected to do more of the same in 2014 until the entire stimulus purchase program is stopped. Certainly the decline in stocks seen in Jan has shaken risk appetite and has been one of the major contributor to current strength in Gold, but considering that US stocks have since stabilized and began to trade higher, we should have seen Gold prices falling slightly as well.
Some may say that stimulus speculation (e.g. expecting Yellen to stop tapering) may be the true driver that sent both Stocks and Gold higher recently, and this assertion appears to be reasonable given that interest yields are remaining depressed. However, it should be remembered that current long-term downtrend started shortly after QE3 was announced back in 2012 September, and since additional QE didn’t really drive Gold prices up nor even keep prices afloat, why is a lack of reduction in the aforementioned QE purchase driving prices higher?
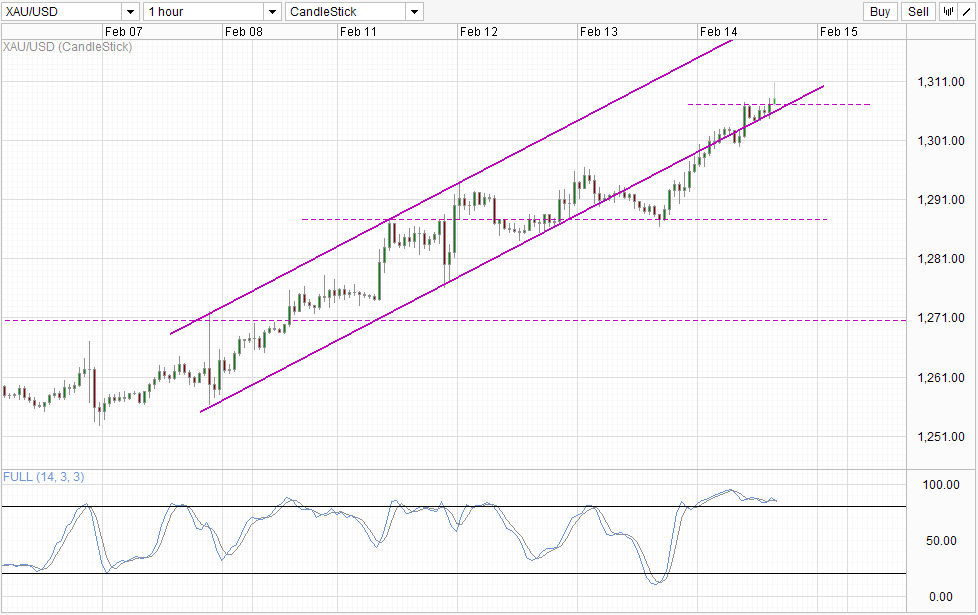
Hourly Chart
We can postulate and discuss the merits of different theories of why Gold prices is higher, but the fact is that prices are indeed pushing higher, and we have to accept that bullish momentum is strong right now with 1,300 round figure resistance crossed. From a technical perspective, with prices trading back within the rising Channel, the momentum that has been in play since Monday has been restored and we could see further bullish endeavours next week. Channel Top will be the obvious target, but the likelihood of prices hitting this in the last 12 hours of this week’s trade may be hard as Friday’s tend to see pullbacks from the dominant trend during the week as traders have a higher tendency to take profit from their earlier positions.
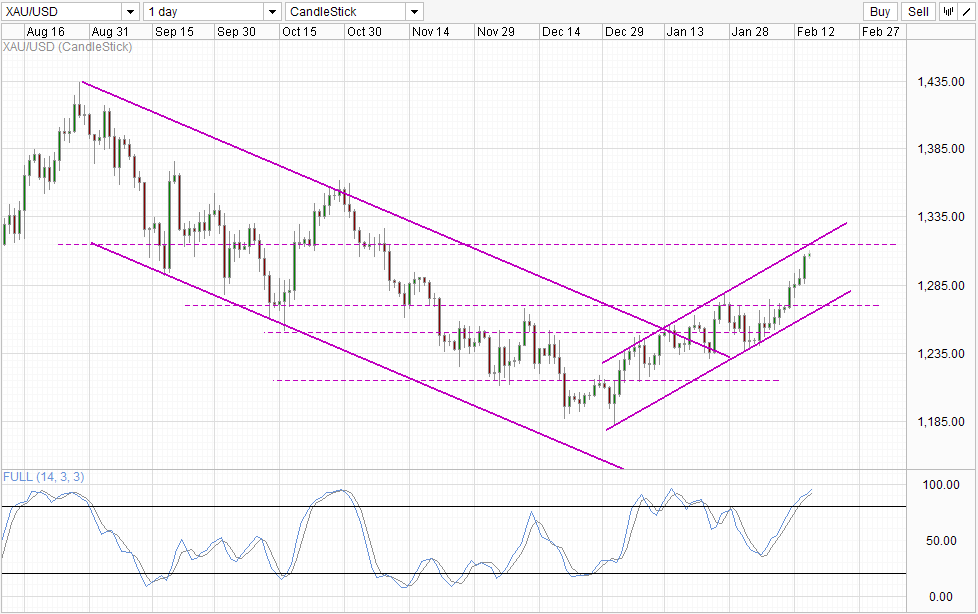
Daily Chart
This is affirmed on the Daily Chart where Gold has significant resistance in the form of 1,315 and Channel Top which price will need to overcome in order to hit the Short-Term Channel Top which is sitting above 1,315 right now. Given that fundamental reasons for Gold rally is sketchy and looming resistances which will be hit in the near future, a short-term correction will be possible as well. This notion is echoed by Daily Chart’s Stochastic indicator which is heavily Overbought right now. This does not invalidate the bullish trend that is in play right now, but certainly should put pause to traders who may want to rethink about their decision to buy Gold right here right now following a break of 1,300.
More Links:
WTI Crude – Quest Above 100.57 Part Deux
This article is for general information purposes only. It is not investment advice or a solution to buy or sell securities. Opinions are the authors; not necessarily that of OANDA Corporation or any of its affiliates, subsidiaries, officers or directors. Leveraged trading is high risk and not suitable for all. You could lose all of your deposited funds.


