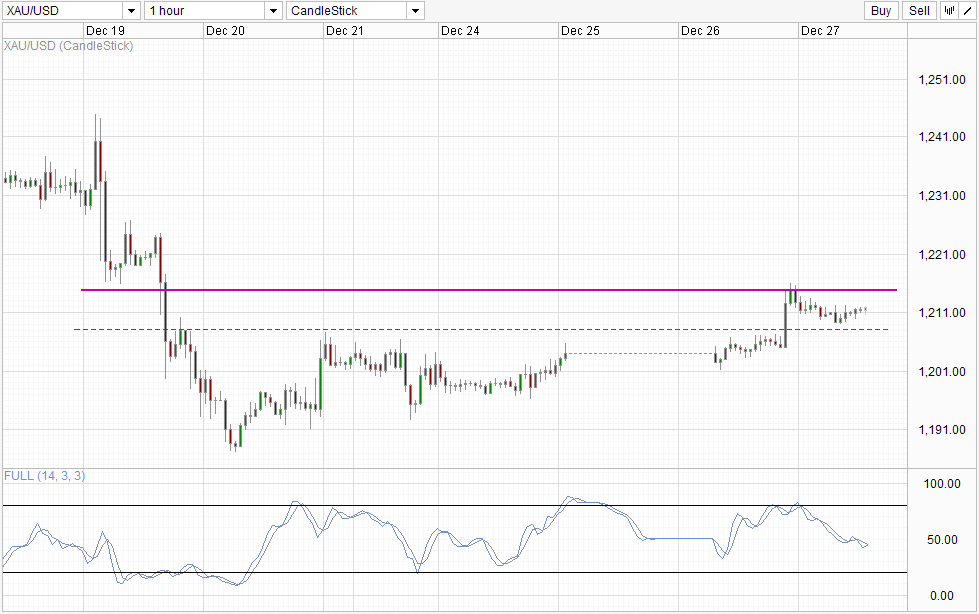
Gold prices shot up suddenly yesterday out of nowhere yesterday, but before bulls get excited about a longer-termed bullish reversal, it should be noted that the rally may be triggered by short-covering and the clearing of hedges by institutions as the year end draws near. Furthermore, yesterday’s rally did not manage to breach into the post QE Tapering consolidation zone between 1,215 – 1,227, suggesting that the overall bearish pressure remains intact, and an eventual push back below 1,208 soft resistance turned support is possible as long as we stay beneath 1,215.
Hourly Chart
That being said, momentum since last Friday has been bullish, and with 1,208 not even tested right now, a retest of 1,215 cannot be ruled out especially since Stochastic readings suggest that Stoch curve may be reversing higher with a Stoch/Signal cross around the 50.0 level. This doesn’t mean that price is bullish, just that bears have yet to prove themselves yet and it may be presumptuous to assume that the long-term bearish trend will push price lower from here.
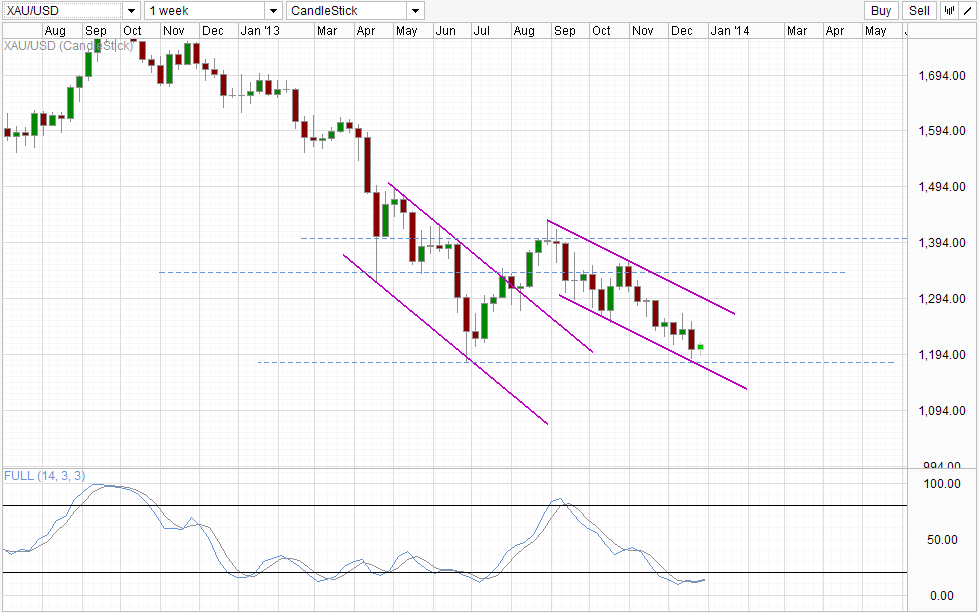
Weekly Chart
Speaking of long-term bearish pressure, the possibility of bearish momentum pulling back is real with last week’s low tagging Channel Bottom and confluence with the previous swing low back in June. Stochastic readings are also moving up slightly after languishing in the Oversold region for quite some time, favouring a bullish retracement after not seeing any since the decline that started from early November.
Obvious bullish target would be Channel Top, but expect significant resistance around 1,250 round figure which was the swing low back in October before current slide. Also, as overall pressure remains on the downside, there is the chance that prices may reverse lower again without hitting any bullish objective – but that would be the risk of swimming against the flow as most if not all traders should have known by now.
Fundamentally Gold prices can still head lower, but it depends on who you ask. Based on the cost of mining, Gold should stay close to $1,200 per ounce, but if we consider historical average and adjust for inflation, the number is closer to $800 – $900. Either way, we should not be expecting the same magnitude of decline seen this year.
More Links:
EUR/USD Technicals – S/T Bears Banished But It’s No Bullish Wonderland
GBP/USD – Strong Gains After Positive US Unemployment Claims
USD/JPY – New Highs (yet again) But Bullish Conviction Low
This article is for general information purposes only. It is not investment advice or a solution to buy or sell securities. Opinions are the authors; not necessarily that of OANDA Corporation or any of its affiliates, subsidiaries, officers or directors. Leveraged trading is high risk and not suitable for all. You could lose all of your deposited funds.


