- Trump’s clean sweep saw a significant rise in the US Dollar and Yields. Can it continue?
- Data in focus next week, US CPI data is due with potential implications for Federal Reserve policy and interest rate decisions.
- US Dollar Index (DXY) breaks above key level of 105.00. Where to next for the Greenback?
Read More: Gold Prices Plunge as Trump Triumphs: What’s Next for XAU/USD?
Week in Review: Trump Trade in Spotlight as US Dollar and Yields Rise
A blockbuster week comes to a close with a slow Friday as markets still digest the news and potential developments after Donald Trump swept to victory in the US elections. Not a surprise, at least from my side, however there were a few moves in markets that took me by surprise.
Looking back at the week, the US Dollar and Wall Street indexes rose sharply following Trump’s victory. This should not have come as a surprise given the much discussed Trump trade in the lead up to the election or the growing narrative that Trump will be a positive for economic growth.
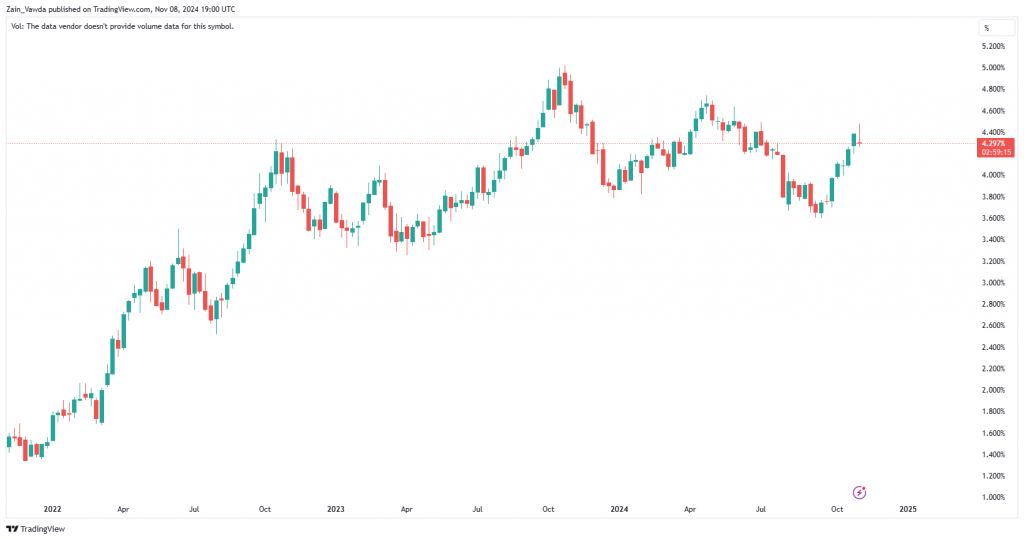
The 47th President of the United States will only assume office on January 20, 2025. Despite this, markets are already beginning to anticipate the effect of some of Trump’s policies which are likely to be implemented. The biggest one being tariffs which if implemented could potentially lead to an uptick in inflation and potentially slower rate cuts. We are already seeing the effect in the lead up to and since the election as US yields rose on heightened inflation expectations. However, a December rate cut remains firmly on the cards with January likely to be an interesting meeting for the Fed as incoming President Trump would have just assumed office.
The US Dollar Index (DXY) has hit levels last seen in July, which together with the rising US Yields dragged Gold prices down to a weekly low around 2642. However, Thursday saw a significant recovery for the precious metal but it looks set to end the week below the $2700 handle. US Yields did however give back most of the gains made this week trading flat at the time of writing.
Source: TradingView
Oil prices had a surprisingly muted week given the moves across global markets. Brent was trading around 1% down for the week at the time of writing.
On the FX front, the rise of the USD index has dragged Cable and EUR/USD lower with emerging markets. One of the biggest winners of the week is undoubtedly Bitcoin which printed two fresh highs, first at 75000 and then on Friday a fresh high at 77000. A lot of the move is down a Trump presidency with the incoming President a proponent of the Cryptocurrency industry.
The Week Ahead: China’s Standing Committee Meeting
Asia Pacific Markets
The week ahead in the Asia Pacific region will see a slowdown with the exception of data from China.
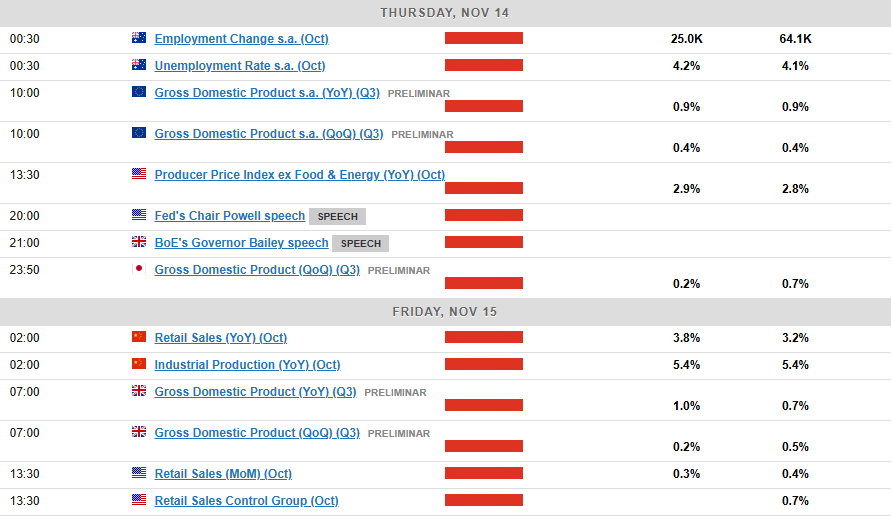
In China, CPI data will be released on Saturday morning, and it is expected to stay around 0.4% compared to last year. More data will be released next Friday, and it is anticipated that the numbers will be a bit stronger for October, following the monetary easing from September. Housing prices will be watched closely for signs that they are starting to stabilize, and even a smaller drop than usual would be seen as positive news.
Japan will release its third-quarter GDP data next week. Growth is expected to slow to 0.3% from 0.8% in the second quarter because of typhoon and earthquake warnings affecting economic activities. Private consumption is expected to increase a little, but construction and facility investment might decrease. Growth is anticipated to pick up again in the fourth quarter due to a rebound.
Australia’s labor market is expected to slowly weaken in the fourth quarter, with unemployment increasing to 4.3%. This is because while there are still many people available for work, the number of new jobs being created is slowing down.
Europe + UK + US
In developed markets, the Euro Area will have a break from high impact data. There are some data releases from smaller countries which are likely to have a minimal impact on the under pressure Euro.
In the UK, the unemployment rate is expected to go up slightly, but these numbers are seen as unreliable because of sampling problems. Other payroll data shows that hiring outside the government has dropped a lot this year. Wage growth is likely to slow down as well, partly because of comparisons to previous high numbers.
UK GDP data is also due, monthly data indicates that growth in the third quarter was much slower compared to the first half of the year, partly because of earlier data fluctuations. Surveys show that the pace has slowed a bit, but the new budget is expected to help increase growth next year.
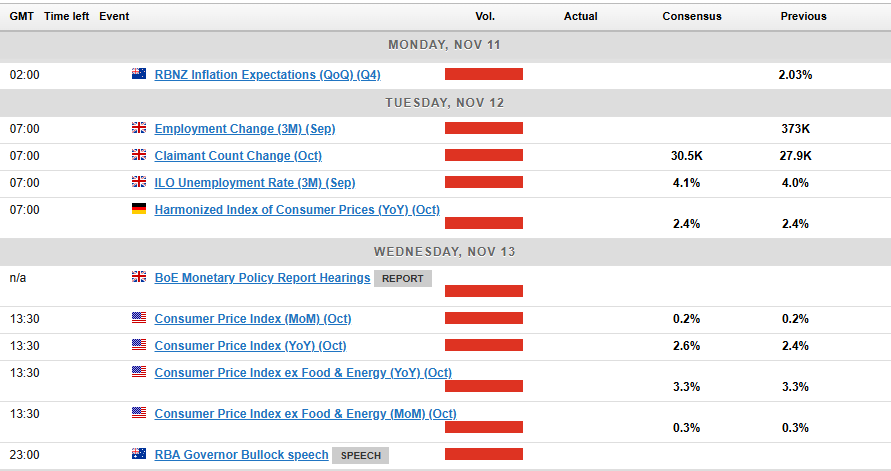
In the US next week attention shifts firmly back to data. Although market attention has shifted to the jobs market I expect inflation to still hold weight moving forward especially after the election.
Used and new car prices are expected to rise for October’s CPI, keeping the overall rate at 0.2% and core CPI at 0.3%. This is above the 0.17% monthly rate needed for the 2% inflation target, which might lead to doubts about the Fed cutting rates in December. However, with a cooling job market and tight monetary policy, a rate cut is still anticipated. There might be a pause in January due to possible stronger growth with Donald Trump as President, a business-friendly environment, and higher inflation from trade tariffs.
For all market-moving economic releases and events, see the MarketPulse Economic Calendar.
Chart of the Week
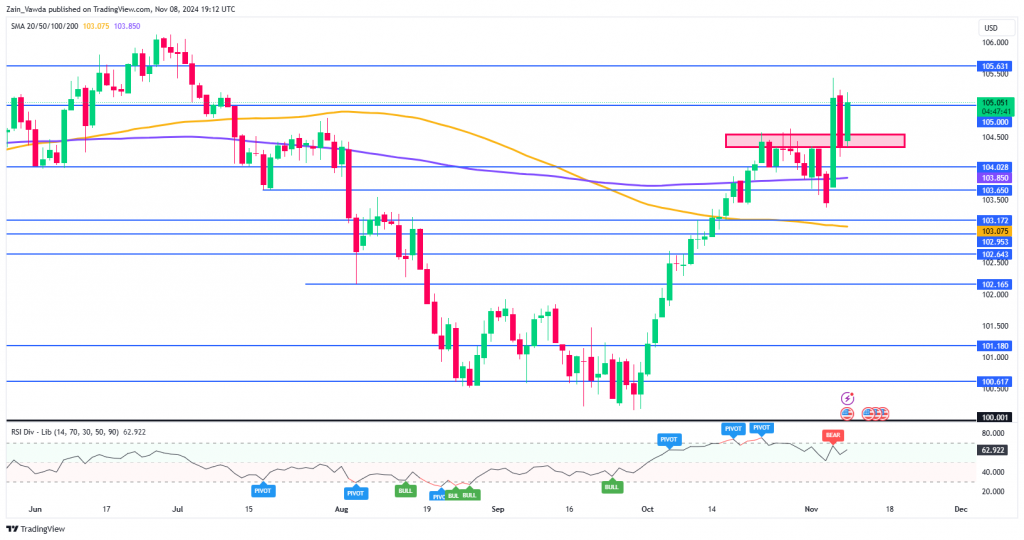
This week’s focus is back to the US Dollar Index (DXY), which has finally broken higher after a brief period of consolidation. Looking at the Trump trade, the question will be whether it continues until Trump’s election.
Looking at the DXY chart there is a key area of support marked off with the red box on the chart around 104.50. Below that we have support at 104.028 with the 200-day MA resting at 103.850 which makes this area a key area of confluence.
Conversely, a move to the upside may find resistance at 105.40 and 105.63 before the 106.00 handle comes into focus.
As I mentioned above, the biggest factor to pay attention to will be whether the ‘Trump trade’ continues, if it dies the DXY may continue higher.
US Dollar Index Daily Chart – November 8, 2024
Source:TradingView.Com (click to enlarge)
Key Levels to Consider:
Support
- 104.50
- 104.00
- 103.65
Resistance
- 105.40
- 105.63
- 106.00
Follow Zain on Twitter/X for Additional Market News and Insights @zvawda
Content is for general information purposes only. It is not investment advice or a solution to buy or sell securities. Opinions are the authors; not necessarily that of OANDA Business Information & Services, Inc. or any of its affiliates, subsidiaries, officers or directors. If you would like to reproduce or redistribute any of the content found on MarketPulse, an award winning forex, commodities and global indices analysis and news site service produced by OANDA Business Information & Services, Inc., please access the RSS feed or contact us at info@marketpulse.com. Visit https://www.marketpulse.com/ to find out more about the beat of the global markets. © 2023 OANDA Business Information & Services Inc.


