Hourly Chart
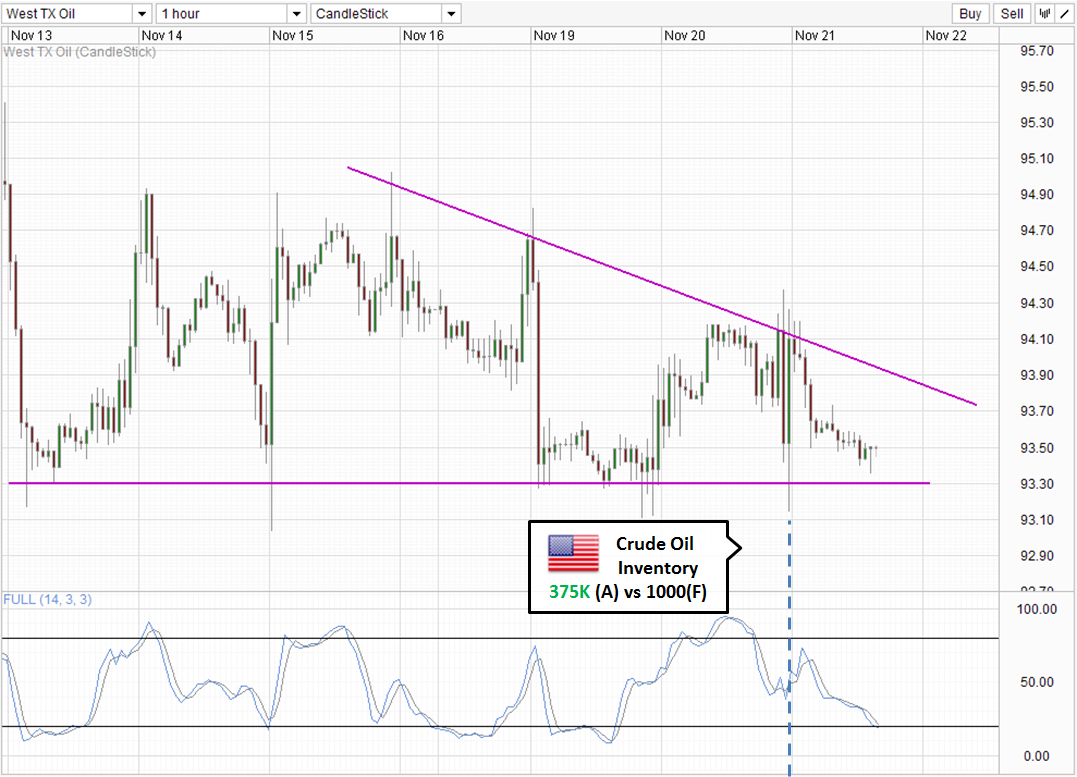
Price action in Crude Oil is interesting. Despite strong sell-off seen in US10Y, Gold and US Stocks, WTI Crude prices remain above 93.3. However, price isn’t outright bullish either, as evident by the bullish push following a better than expected Crude Oil Inventory numbers released by Department of Energy yesterday. The rally failed to clear the 94.1 resistance which is also confluence with the descending trendline despite DOE numbers being the most bullish in 9 weeks, not just from a inventory build up perspective, but it is also the largest negative difference from what analyst expected. This failure hence highlights the weakness in bulls, and coupled with the indecisiveness of bears brings us the conclusion that we could be seeing sideways movement in the short-term if there isn’t any new fundamental news releases that could impact risk appetite/opinion of Crude demand/supply.
Weekly Chart
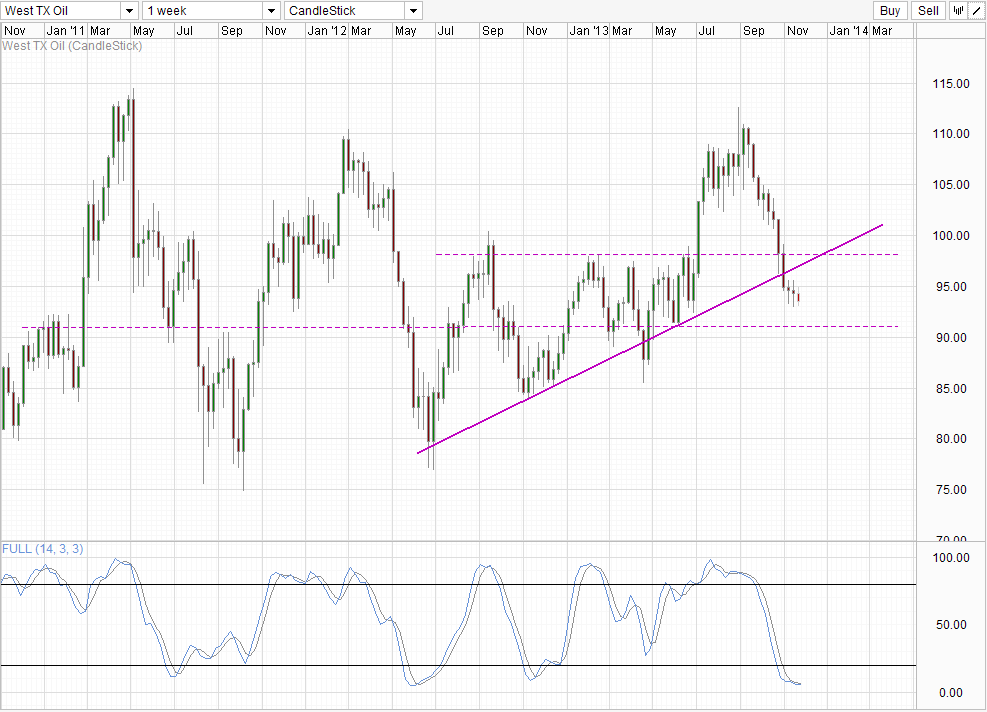
Long-term chart doesn’t give us directional conviction either. Prices are trading below the rising trendline, and by breaking the 98.0 ceiling of early 2013, prices should be able to hit the consolidation zone’s floor around 91.0. However, Stochastic readings are deeply Oversold, and favors a bullish pullback moving forward. This doesn’t invalidate the potential move towards 91.0, but given that S/T bears are not able to push prices lower, it may be a tall order for price to hit 91.0 without further fundamental developments.
Nonetheless, global crude oil supply/demand trend continue to favor lower oil prices in 2014, especially with OECD lowering global and US growth forecast just recently. However, strong bearish momentum may only be visible should 91.0 gets broken, which will open up a move towards 80.0 and high 70.0s eventually. Without breaking 91.0, we could simply see price potentially staying within the 91.0 – 98.0 consolidation and not remain highly volatile within the band – which fits nicely into the hyper-sensitized reaction to QE Taper/No QE Taper narrative that is playing in the market right now.
More Links:
US10Y – Staying above 126.5 for now post FOMC Mintues
US S&P 500 – Stocks Feeling Taper Heat But L/T Bullish Momentum Intact
Gold Technicals – Stable Below 1,250 Post FOMC Minutes
This article is for general information purposes only. It is not investment advice or a solution to buy or sell securities. Opinions are the authors; not necessarily that of OANDA Corporation or any of its affiliates, subsidiaries, officers or directors. Leveraged trading is high risk and not suitable for all. You could lose all of your deposited funds.


