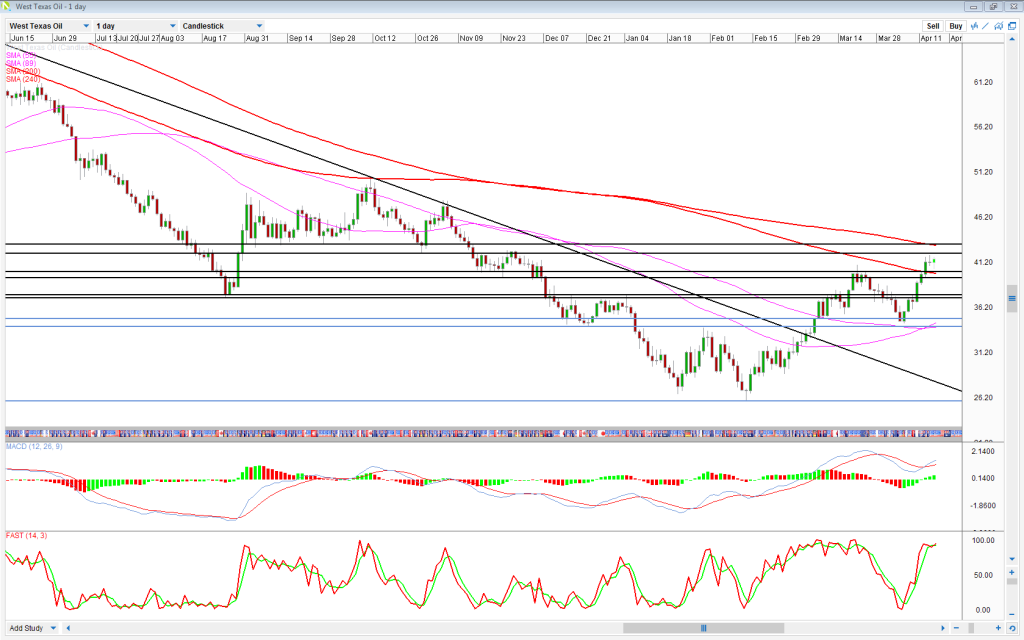
WTI Crude is trading in a very important technical zone right now that could give a strong indication of whether the rally has legs or the correction has ran its course.
The area between the 200 and 240 simple moving averages marks a region that has historically provided support and resistance, with a break potentially representing a broader trend change. With Brent trading in this area currently, we should soon get an idea of which this is.
It is also trading close to an area that was significant support in September and October and became resistance once it was eventually broken in November, between $42.20-43.20.
If we see a break above this zone, which would take out the moving averages in the process, it would be very bullish for Brent and could indicate that much larger gains lie ahead, with the next notable resistance zone coming around $48-49.
Alternatively, should a reversal form around this level, it may suggest that we’re about to see a rotation back to the downside, with the first barrier potentially coming around $39.50-40.
This would be confirmed by a break below $39.40, thereby ending the period of higher lows. Prior to this though, it could find support around $37.25-37.60.
Content is for general information purposes only. It is not investment advice or a solution to buy or sell securities. Opinions are the authors; not necessarily that of OANDA Business Information & Services, Inc. or any of its affiliates, subsidiaries, officers or directors. If you would like to reproduce or redistribute any of the content found on MarketPulse, an award winning forex, commodities and global indices analysis and news site service produced by OANDA Business Information & Services, Inc., please access the RSS feed or contact us at info@marketpulse.com. Visit https://www.marketpulse.com/ to find out more about the beat of the global markets. © 2023 OANDA Business Information & Services Inc.


