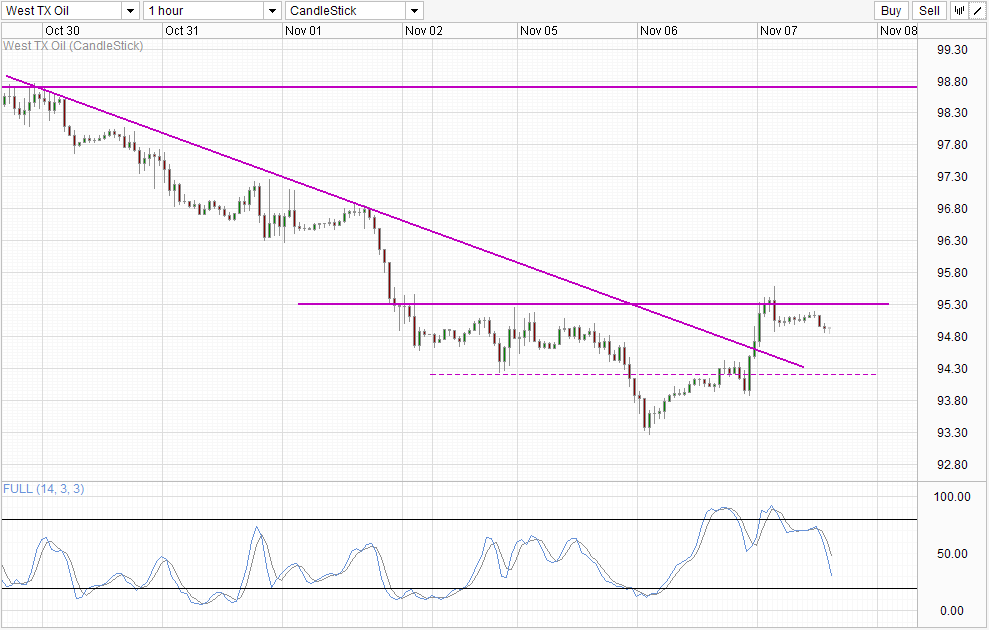
Crude prices rallied higher yesterday following the latest crude inventory data from US Department of Energy. DOE numbers showed an increase of 1.6 million barrels for week ending November 1, slightly lower than analysts consensus estimate of 2.1 million and a huge drop from previous week’s 4 million. This lower buildup, together with Tuesday’s lower than expected buildup as reflected by numbers from American Petroleum Institute, suggest that the oversupply issue may be easing slightly, resulting in prices rebounding from a 5 month low and hitting a high of 95.6 during US trading session.
Hourly Chart
However, it should be noted that the oversupply situation remains, as the number of consecutive weekly inventory buildup now stands at 7. Even though this week’s 1.6 million barrels increase is way below current weekly average of 4.7 million, the new average is still at 4.25 million barrels, much higher than the 8 week and 10 week streak average of under 3 million and 4 million respectively which was discussed yesterday. Therefore, while the problem of oversupply has eased, we are still a far way from seeing supply/demand restabilizing. Furthermore, even if the problem of oversupply has been fully eradicated, this will not be a valid reason for price rallying, but merely resulting in the lack of further bearish movements. Hence it will not be unreasonable to say that a long-term bullish push will not be happening anytime soon.
This notion is reflected in price action as well, where prices have found resistance around 95.3, the top end of the consolidation channel found on Monday/Tuesday. Without breaking the resistance, overall bearish bias remain intact, and the 94.2 opens up as the immediate bearish target. Stochastic readings agree with price within a bearish cycle currently, readings are also rather close to the Oversold region as well – suggesting that additional bearish movement beyond 94.2 may be difficult.
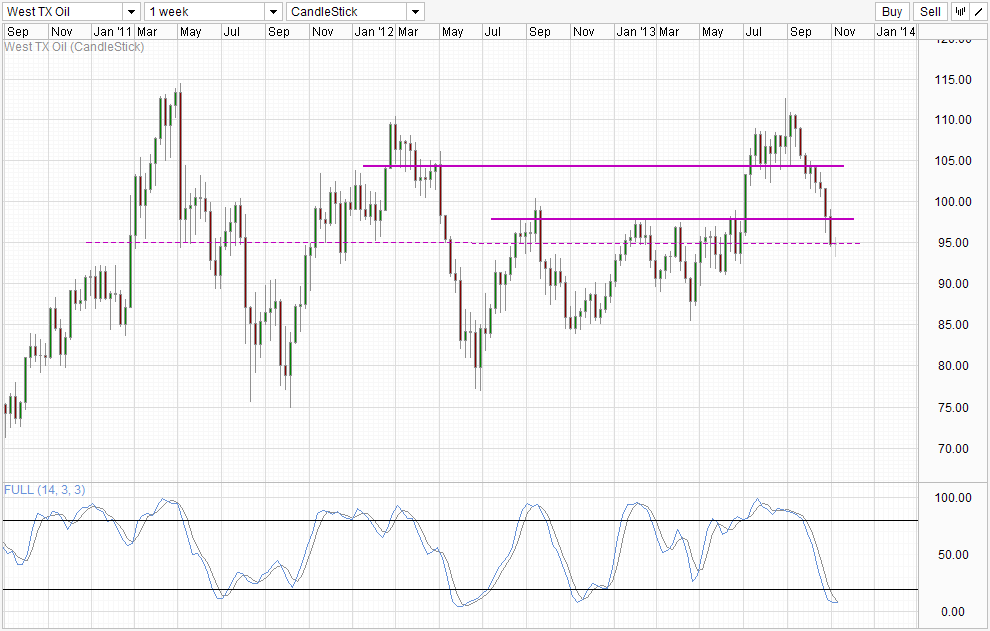
Weekly Chart
Weekly Chart is mixed though. Even though current momentum is undoubtedly bearish, the magnitude of this current bearish decline without any significant bullish pullback in between suggest that a bullish recovery may be due very soon. Right now, stochastic readings suggest that bearish momentum is already under threat with Stoch curve looking likely to cross the Signal line, while price action is showing a long legged Doji. This in itself does not mean that a bullish reversal is happening, just that current bearish momentum is uncertain, giving bulls the opportunity to seize initiative.
But that is from a pure technical perspective, with fundamentals for crude oil demand continuing looking weak, it is difficult to establish a firm bullish narrative. Nonetheless, we could still see technical pullbacks which can potentially bring us back towards 98.0 resistance. The failure to break 98.0 would be a strong bearish confirmation and we could see stronger bearish momentum arising from there with bears who were still staying on the sideline able to enter the market knowing that the inevitable bullish pullback has already occurred.
More Links:
USD/INR Technicals – Bullish Breakout on Short and Long Term Charts
Dow 30 – New Record Close But Bearish Risk Remains
AUD/USD – Bearish Floodgates Waiting To Open After Dismal Job Numbers
This article is for general information purposes only. It is not investment advice or a solution to buy or sell securities. Opinions are the authors; not necessarily that of OANDA Corporation or any of its affiliates, subsidiaries, officers or directors. Leveraged trading is high risk and not suitable for all. You could lose all of your deposited funds.


