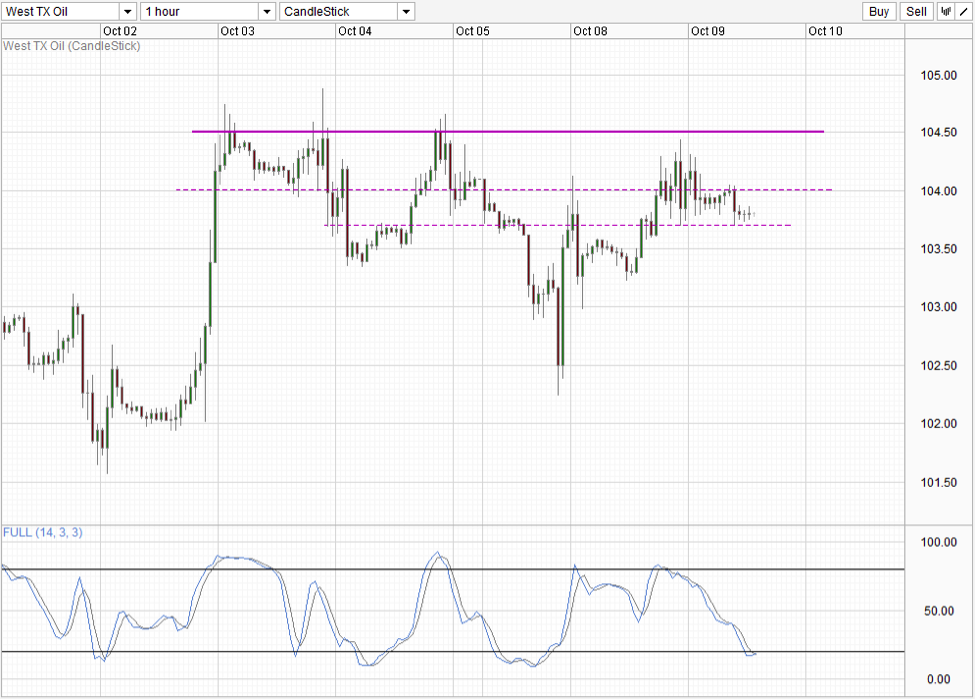
Despite all the supposed doom and gloom surrounding US Debt Ceiling and Government Shutdown deadlock, Oil prices continue to remain nicely supported, staying between 103.5 and 104.5 during yesterday’s US trading session when US stocks took a beating – with S&P 500 dropping by 1.23% and Dow 30 by 1.07%. Comparatively, WTI Crude is doing far better.
This strong support in crude becomes even more inexplicable when we consider that global supplies of oil continue to strengthen. Within the US, American Petroleum Institute showed that crude inventories have climbed by 2.8 million barrels. Furthermore, Tropical Storm Karen has subsided without dealing any significant damage beyond loss of man hours. Beyond US, Saudi Arabia – biggest exporter of crude – has been pumping out more than 10 million barrels each day for the past 3 months, giving the highest quarterly output since 1980. When we throw in the expected decline in Chinese economy and the potential US recession, we have a case of increasing supply and decreasing demand – extremely bearish outlook for Oil.
Hence, this implies that technical/speculative influences are keeping Crude Oil prices up right now. With that in mind, the likelihood of 103.0 support holding increases, and we have precedence as well. Prices dipped below 103.0 on Monday, but bulls quickly sent prices up higher again, demonstrating the immense bullish support beneath the 103.0 level. In similar vein, 104.5 resistance will likely hold if ever tested, keeping price between 103 – 104.5 for now.
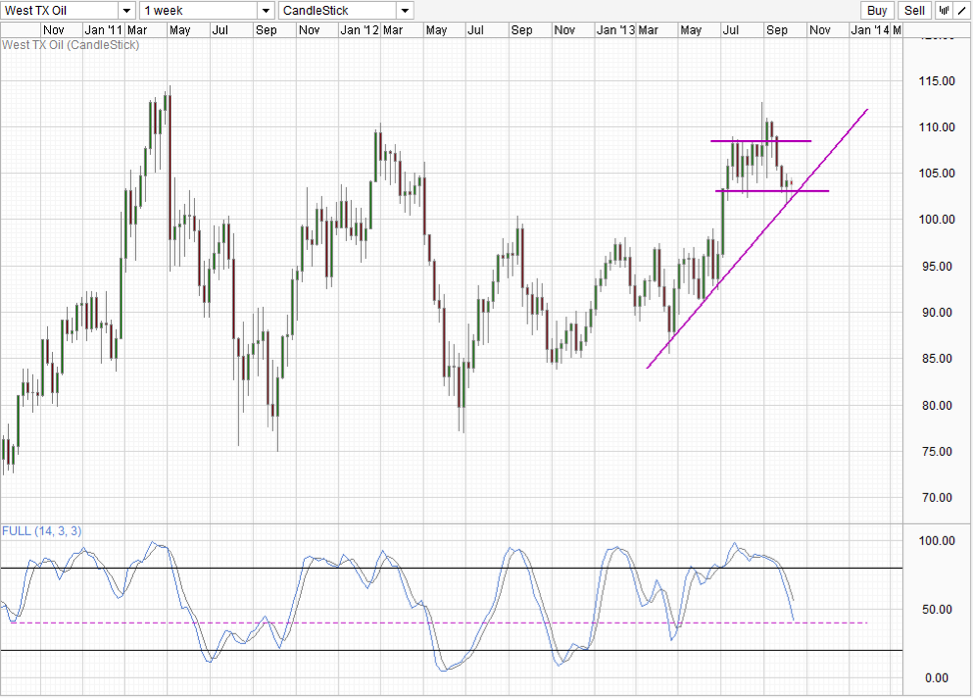
The rising trendline seen on the Weekly Chart will provide further support that will keep price above 103.0. Stochasitc indicator may still be pointing lower and indicating that the bearish momentum is still in play, but it is possible that Stoch curve may U-turn soon as we approach the 40.0 level which has been acting as point of inflexions in the past. If price close above 103.0 this week with Stoch curve flattening/rebounding off 40.0, we could see quick acceleration towards 104.5 and potentially spark a move towards 108.5. Conversely, if price manage to break the intersection between trendline/103.0 support in the next 1-2 weeks, the long term top will be confirmed and opens up a move towards 80.0 as ultimate bearish target.
Today we are expecting inventory data from the Energy Information Administration, but given that market is less sensitive to fundamentals with strong technical influences remain in play, it is likely that we may simply see short-term volatility resulting from this while 103.0 -104.5 trading range remaining intact.
Content is for general information purposes only. It is not investment advice or a solution to buy or sell securities. Opinions are the authors; not necessarily that of OANDA Business Information & Services, Inc. or any of its affiliates, subsidiaries, officers or directors. If you would like to reproduce or redistribute any of the content found on MarketPulse, an award winning forex, commodities and global indices analysis and news site service produced by OANDA Business Information & Services, Inc., please access the RSS feed or contact us at info@marketpulse.com. Visit https://www.marketpulse.com/ to find out more about the beat of the global markets. © 2023 OANDA Business Information & Services Inc.


