- Bitcoin prices have fallen from their recent high due to concerns over Mt. Gox repayments.
- Despite the drop in Bitcoin’s price, BlackRock’s spot Bitcoin ETF saw its largest inflow in over four months.
- From a technical standpoint, Bitcoin found support over the weekend but a hanging man candlestick close hinted at potential downside.
- ETH ETF to go live. Will Bitcoin benefit?
Most Read: FTSE 100 Consolidates, S&P 500 Faces Critical Test, Earnings Ahead
Bitcoin prices have seen a pullback from the recent high of $68486 yesterday. The drop off is seen as a response to potential payments and movements of Bitcoin by Mt. Gox as they look to continue their repayments.
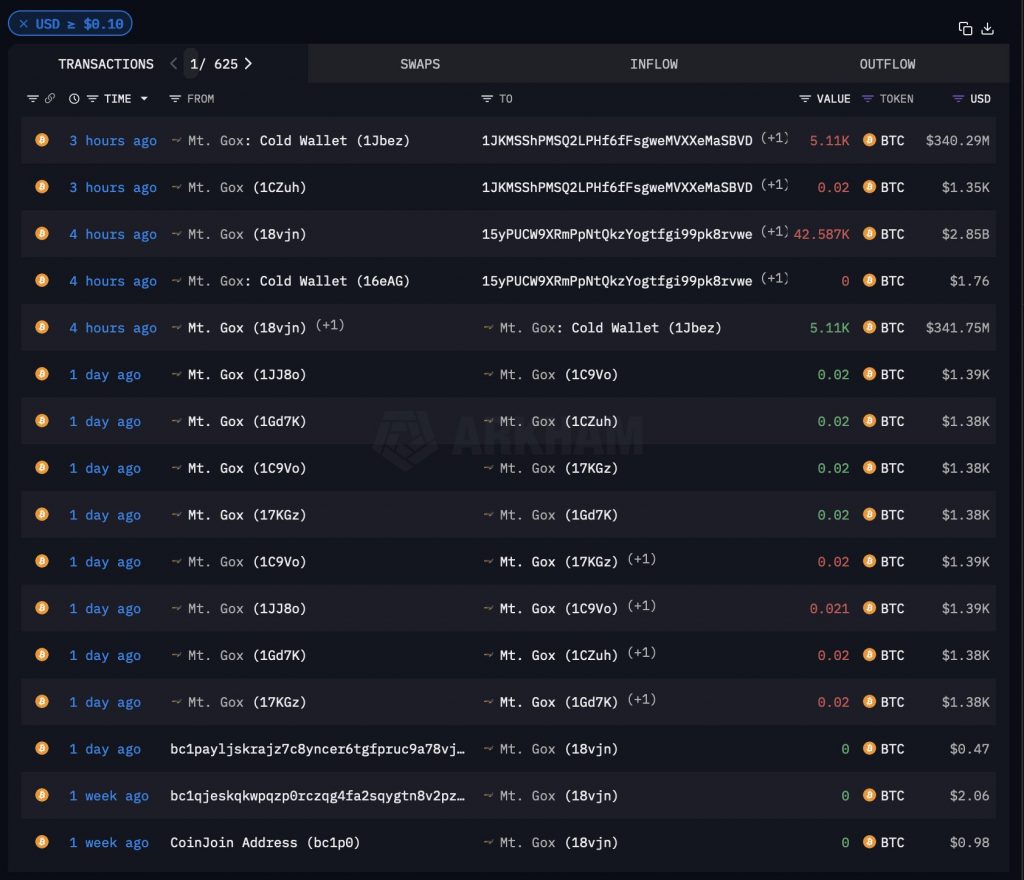
The Mt. Gox address has conducted its initial test transactions to the Bitstamp cold wallets. Blockchain intelligence firm Arkham Intelligence identified these test transactions in a post on X (formerly Twitter) on July 22. Link to the tweet.
Source: X.com/Arkham Intelligence
Over $9.4 billion worth of Bitcoin is owed to about 127,000 Mt. Gox creditors who have been waiting more than 10 years to get their funds back.
However, some crypto investors are concerned that the Mt. Gox repayments might lead to sell pressure, potentially lowering Bitcoin’s price. This seems to have worried market participants, with Bitcoin remaining in the red for the second day in a row.
This was supposed to be a positive day for the industry as the Ethereum (ETH) ETF is set to go live. There is speculation that an ETH ETF could indirectly benefit Bitcoin, as investors who are not particularly interested in Bitcoin may add it to their portfolios alongside ETH to mitigate risk and diversify.
ETF Flows Break Records
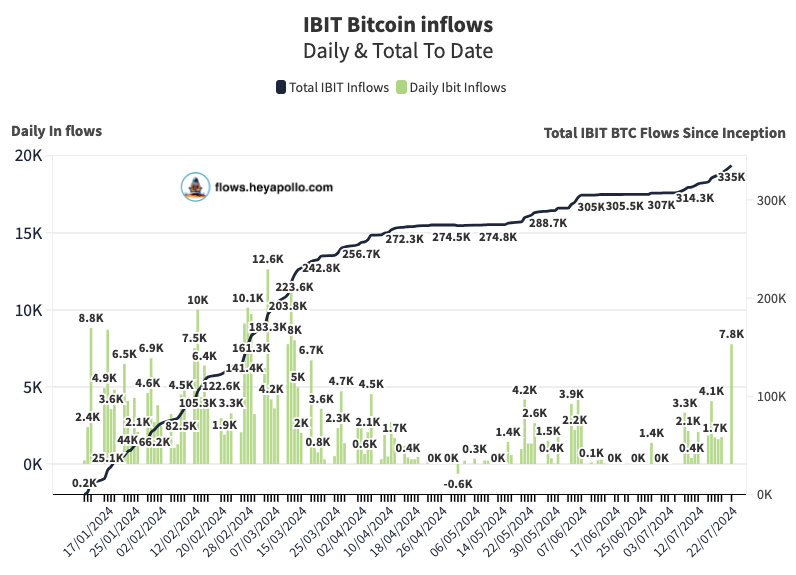
The drop in the price of Bitcoin comes as BlackRock’s spot Bitcoin exchange-traded fund (ETF) saw its largest inflow in over four months, with more than $523 million entering the fund on Monday.
On July 22, the iShares Bitcoin Trust ETF (IBIT) acquired 7,759 Bitcoin, valued at just over $523 million at the time, according to Hey Apollo data shared by its co-founder in a July 23 post on X.
IBIT ETF Flows
Source: X.Com, Heyapollo.com
Technical Analysis BTC/USD
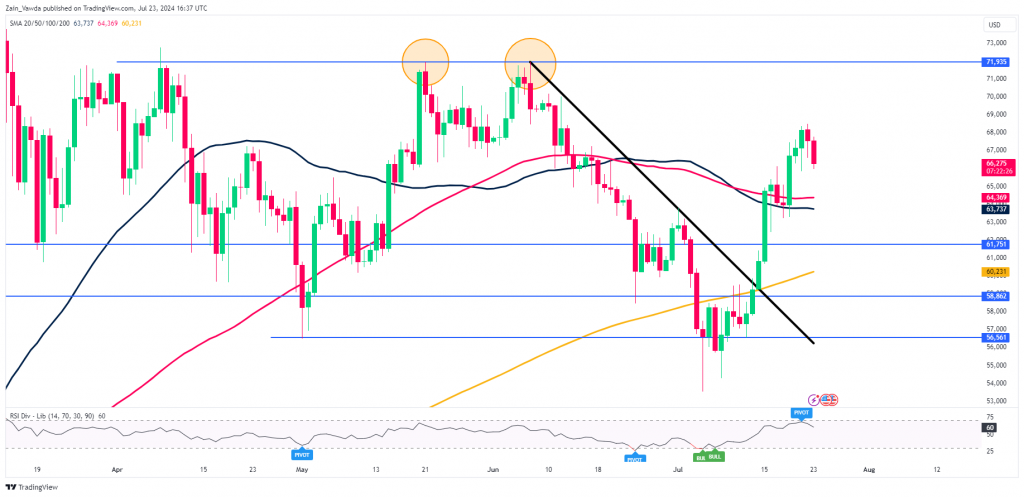
From a technical standpoint, Bitcoin found support over the weekend bouncing off the 50 and 100-day MAs before going on to the most recent high around $68486. Yesterday hanging man candlestick close hinted at potential downside which has since materialized.
Immediate support rests between 64370 and 63737 and is provided by the 50 and 100-day MAs. A break lower and support at 61751 comes into focus before the 200-day MA just above the 60000 psychological level.
Support
- 64370
- 63737
- 61751
Resistance
- 68486
- 70000 (psychological level)
- 71935
Bitcoin (BTC/USD) Daily Chart, July 23, 2024
Source: TradingView.com (click to enlarge)
Follow Zain on Twitter/X for Additional Market News and Insights @zvawda
Content is for general information purposes only. It is not investment advice or a solution to buy or sell securities. Opinions are the authors; not necessarily that of OANDA Business Information & Services, Inc. or any of its affiliates, subsidiaries, officers or directors. If you would like to reproduce or redistribute any of the content found on MarketPulse, an award winning forex, commodities and global indices analysis and news site service produced by OANDA Business Information & Services, Inc., please access the RSS feed or contact us at info@marketpulse.com. Visit https://www.marketpulse.com/ to find out more about the beat of the global markets. © 2023 OANDA Business Information & Services Inc.


