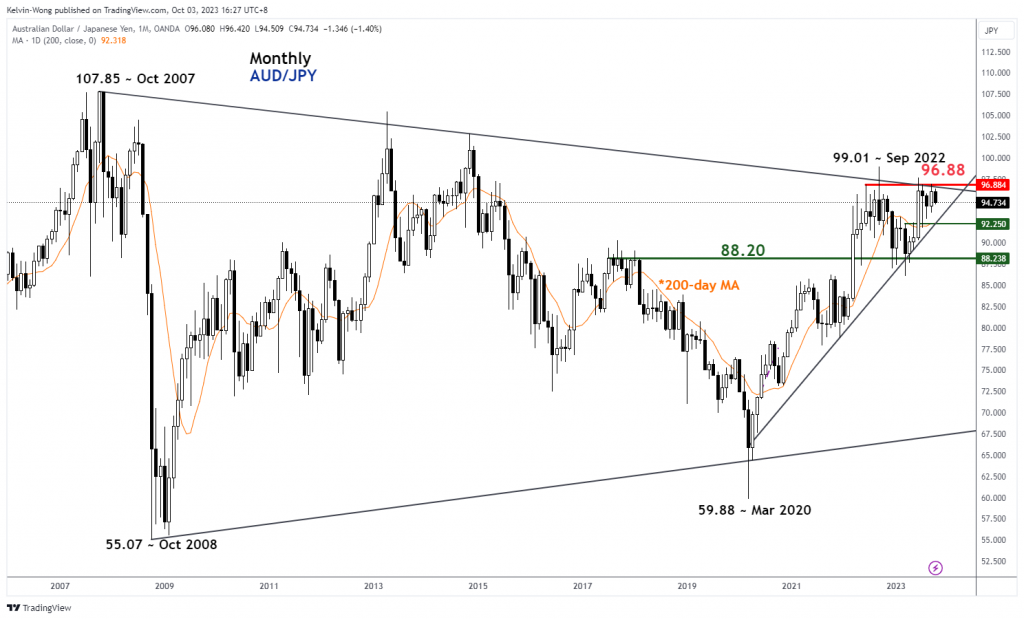
- The multi-year up move of the AUD/JPY from the March 2020 low of 59.88 has shown bullish exhaustion conditions right at the long-term secular range resistance of 96.88.
- Today’s RBA monetary policy decision has reinforced the short-term bearish tone via the breakdown below the 20-day moving average.
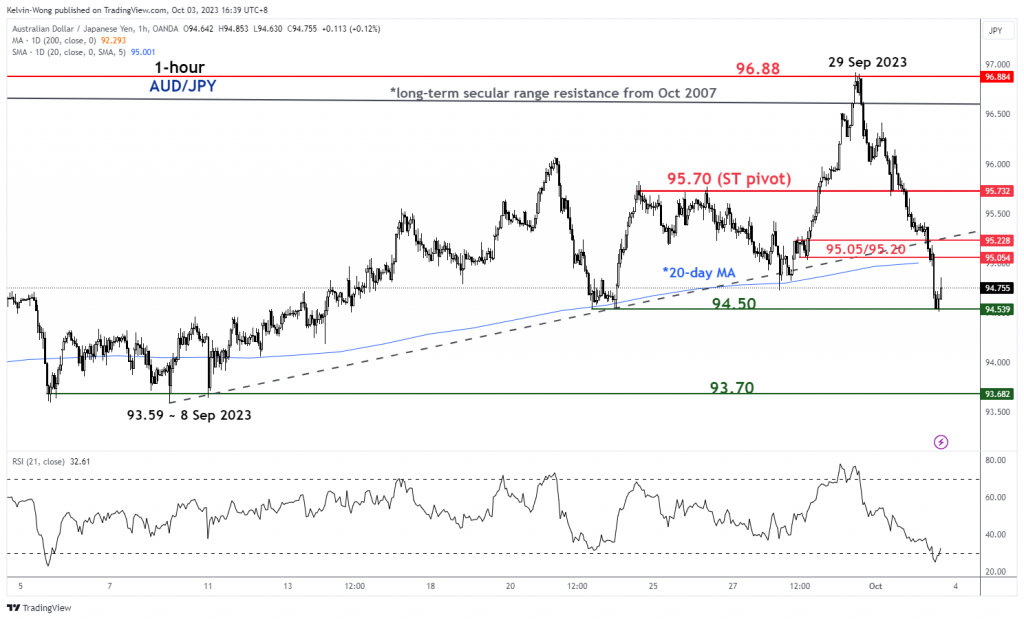
- Key short-term resistance to watch will be at 95.70 which also coincides with the 50% Fibonacci retracement of the current minor short-term downtrend phase from 29 September 2023 high to today, 3 October current intraday low of 94.50.
The cross-pair AUD/JPY has continued to tumble in today’s Asia session (3 October) and broke below its 20-day moving average right after the monetary policy decision of the Australian central bank, RBA to keep its cash policy rate unchanged at 4.1% for the fourth consecutive meeting.
Today’s move from RBA has been widely expected as inflationary pressure in Australia has started to ease with the latest reading released yesterday, 2 October from the private sector compiled Melbourne Institute’s monthly inflation gauge that slipped to 0% m/m in September from 0.2% m/m in August.
The RBA has continued to offer a “balance view” in terms of its latest monetary policy guidance where it painted a picture that stated the current inflationary environment in Australia is still too high despite it may have passed its peak as it may stay at elevated levels for quite some time. Reiterated that any interest rate adjustment will be data dependent due to the evolvement of economic growth and inflation pressure.
Potential start of multi-week down move sequence
Fig 1: AUD/JPY long-term secular trend as of 3 Oct 2023 (Source: TradingView, click to enlarge chart)
Overall, from the lens of technical analysis, the current short-term downtrend phase of the AUD/JPY that shed – 241 pips from its 29 September 2023 high of 96.92 to today’s current intraday low of 94.50 has reacted off from a long-term secular range resistance at 96.88 (see monthly chart) which suggests a potential medium-term bearish reversal may be in progress.
Hence, an increase in odds that the AUD/JPY is likely to shape a multi-week down move to test its 200-day moving average that is now acting as a support at 92.25 which also coincides with the major ascending trendline from March 2020 swing low of 59.88.
Oversold in the short-term
Fig 2: AUD/JPY minor short-term trend as of 3 Oct 2023 (Source: TradingView, click to enlarge chart)
The price actions of the AUD/JPY have reached an oversold condition as indicated by the hourly RSI indicator which in turn may see a minor corrective bounce to retest the 20-day moving average and the former minor ascending support from 8 September 2023 low that now confluences at an intermediate resistance zone of 95.05/95.20.
Watch the 95.70 key short-term pivotal resistance to maintain the status of short-term downtrend scenario for a further potential down leg to test the next intermediate support at 93.70 (minor swing low areas of 5/8 September 2023) in the first step.
On the flip side, a clearance above 95.70 invalidates the bearish tone to see a retest on the 96.88 key long-term secular resistance.
Content is for general information purposes only. It is not investment advice or a solution to buy or sell securities. Opinions are the authors; not necessarily that of OANDA Business Information & Services, Inc. or any of its affiliates, subsidiaries, officers or directors. If you would like to reproduce or redistribute any of the content found on MarketPulse, an award winning forex, commodities and global indices analysis and news site service produced by OANDA Business Information & Services, Inc., please access the RSS feed or contact us at info@marketpulse.com. Visit https://www.marketpulse.com/ to find out more about the beat of the global markets. © 2023 OANDA Business Information & Services Inc.


