- US President-elect Trump’s proposed policies may trigger a further upside movement on longer-term US Treasury yields.
- A break above the 4.49% on the US Treasury yield may see a further potential rally towards 5.20%.
- A further reduction of the 2-year and 10-year yield spread between the Australian government sovereign bonds and US Treasuries may put further downside pressure on the AUD/USD.
This is a follow-up analysis of our prior report “AUD/USD: Under downside pressure from China’s weak inflation” published on 14 October 2024. Click here for a recap.
Among the developed nations’ central banks, the Australian central bank, RBA is the sole “lone ranger” (except Japan’s BoJ) that continued to defend its staunch “cautiously hawkish” guidance and kept its short-term policy interest rate unchanged at 4.35%, a 13-year high.
In the recent RBA monetary policy meeting that concluded on Tuesday, 5 November, RBA Governor Bullock reiterated that interest rates in Australia need to stay restrictive for the time being due to upside risks to services inflation.
Even though the labour market has softened, RBA does not see a massive sharp deterioration in underlying conditions. In addition, Australia’s core CPI has eased to 3.5% y/y in Q3 from its Q4 2022 peak print of 6.8%, but RBA’s latest forecast showed core inflation trend will likely only hit its 2-3% target by mid-to-late 2025.
Hence, market participants expect the RBA to only enact its first interest rate cut in either May or July next year, and based on the RBA Rate indicator as of 6 November that calculates a percentage probability of an RBA interest rate change based on the market-determined prices in the ASX 30-day interbank cash rate futures market suggests an implied interest rate cut of 47 basis points (bps) in total for 2025.
Relentless push-up in the 10-year US Treasury yield
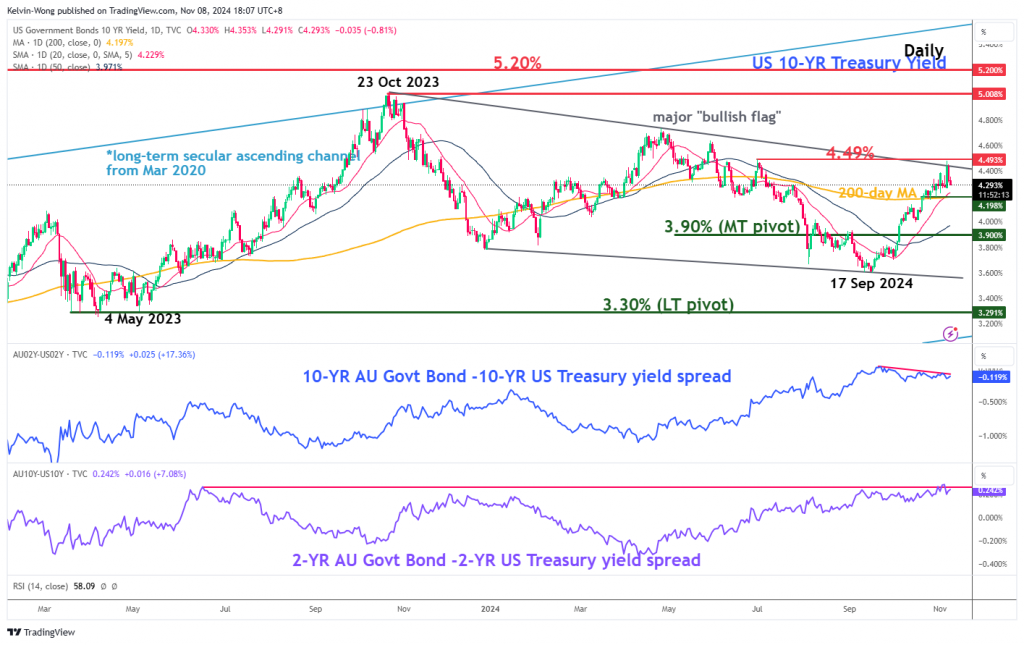
Fig 1: Medium-term & major trends of 10-year US Treasury yield with yield spreads of AU sovereign bonds/US Treasuries
(Source: TradingView, click to enlarge chart)
US President-elect Trump’s proposed deep cut on the corporation tax rate from 21% to 15% is likely to further increase the US budget deficit. In addition, the proposed higher trade tariffs on Chinese and the rest of the world’s imports may also revive inflationary pressure in the US economy.
The net effect of Trump’s campaign trail proposed policies is higher longer-term US Treasury yields which the bond vigilantes have responded to in the past four weeks.
The start of the current US Federal Reserve interest rate cut cycle on 18 September saw a jumbo 50 basis points (bps) cut on the Fed funds rate. In contrast, the longer-term 10-year US Treasury yield traded higher and rallied by 88 bps from its 17 September low of 3.60% to print a recent high of 4.47% on US presidential election day, 5 November.
A bullish breakout with a daily close above 4.49% on the 10-year US Treasury yield may see further upside to revisit the 5% to 5.20% major resistance zone which in turn can potentially assert downside pressure on the 2-year and 10-year yield spreads between Australian government sovereign bonds and US Treasuries (see Fig 1).
A reduction in these yield spreads may trigger further downside pressure on the AUD/USD
AUD/USD at risk of revisiting 0.6400/6360
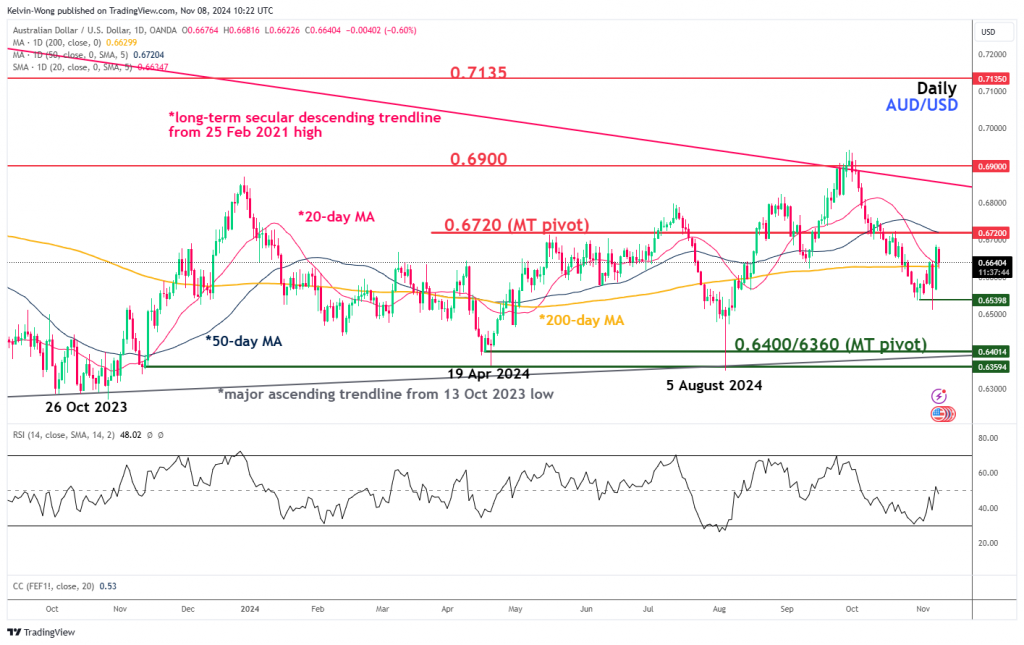
Fig 2: AUD/USD medium-term trend as of 8 Nov 2024 (Source: TradingView, click to enlarge chart)
The price actions of AUD/USD have continued to oscillate within a major complex sideways range configuration since its 13 October 2023 low of 0.6170.
After a test on the upper limit of the major range configuration at 0.6900 on 27 September, the AUD/USD started to decline toward the lower limit of the range, broke below its 50-day moving average, and traded below it since 14 October (see Fig 2).
Watch the 0.6720 key medium-term pivotal resistance. A break below the 0.6540 intermediate support may expose the medium-term pivotal support zone of 0.6400/6360 (also the major ascending trendline from the 13 October 2023 low).
On the other hand, a clearance above 0.6720 negates the bearish tone for a retest on the 0.6900 major resistance (also close to the long-term secular descending trendline from the 25 February 2021 high).
Content is for general information purposes only. It is not investment advice or a solution to buy or sell securities. Opinions are the authors; not necessarily that of OANDA Business Information & Services, Inc. or any of its affiliates, subsidiaries, officers or directors. If you would like to reproduce or redistribute any of the content found on MarketPulse, an award winning forex, commodities and global indices analysis and news site service produced by OANDA Business Information & Services, Inc., please access the RSS feed or contact us at info@marketpulse.com. Visit https://www.marketpulse.com/ to find out more about the beat of the global markets. © 2023 OANDA Business Information & Services Inc.


