- Eurozone HICP inflation 2.4% in October (2.9% in September, 2.7% expected)
- Eurozone core HICP inflation 3.6% in October (4.2% in September, 3.9% expected)
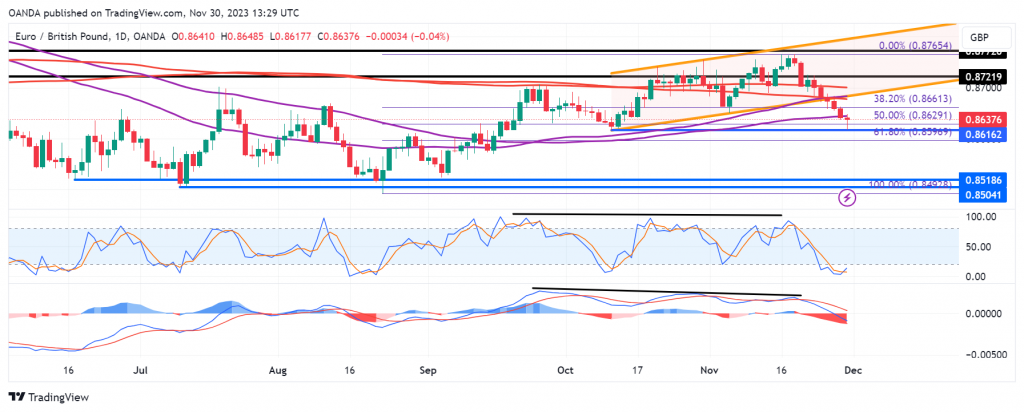
- EURGBP continues lower after bearish breakout on Monday
Eurozone inflation fell much further than expected in October, leaving the headline HICP rate within touching distance of the ECB’s 2% target.
While policymakers have continued to push back against talk of rate cuts, the questions will be impossible to ignore now with markets pricing in one in April and at least four in total next year.
Core inflation remains higher than the headline rate at 3.6% but the pace of deceleration is extremely promising. While policymakers expect inflation to rise slightly over the coming months due to less favorable base effects, they also expected it to fall slower recently so there’s every chance price growth could continue to edge lower.
One thing that been consistent during this inflation crisis has been its unpredictability and perhaps we’re seeing this on the way down too. It was initially transitory, then required some rate hikes and before you knew it, it was accelerating at a much more aggressive pace than anyone expected. Now it’s falling faster than policymakers assumed too.
And with the eurozone economy on the brink of recession, policymakers will have to question whether conditions are too tight based on recent evidence, almost certainly starting at the meeting in two weeks. So far we’ve been told that it’s not the time to even have the conversation but surely that’s no longer true. The December meeting has just become much bigger and forecasts will be crucial.
EURGBP slips again but quickly runs into support
It’s been an impressive run lower over the last week or so, with the break below the rising channel coming in the middle of that.
EURGBP Daily
Source – OANDA on Trading View
It’s now run into support around the 11 October lows and bounced strongly off that level but that doesn’t necessarily mean the sell-off has run its course. The momentum indicators continue to look very healthy, making lower lows alongside the price, for example.
The size of the move we’ve seen since the breakout is also still small compared with the channel itself, which may suggest there’s more to go. Of course, these things are never guaranteed. If we are seeing a brief rebound, though, 0.8680 could be a very interesting area of potential resistance, falling around the bottom of the channel it recently broke below and the 200/233-day simple moving average band.
Content is for general information purposes only. It is not investment advice or a solution to buy or sell securities. Opinions are the authors; not necessarily that of OANDA Business Information & Services, Inc. or any of its affiliates, subsidiaries, officers or directors. If you would like to reproduce or redistribute any of the content found on MarketPulse, an award winning forex, commodities and global indices analysis and news site service produced by OANDA Business Information & Services, Inc., please access the RSS feed or contact us at info@marketpulse.com. Visit https://www.marketpulse.com/ to find out more about the beat of the global markets. © 2023 OANDA Business Information & Services Inc.


