- Tokyo core-core CPI (excluding fresh food & energy) accelerated to a 31-year high
- BoJ’s latest guidance from Governor Ueda is no longer making wage growth as a main priority, raising the possibility of a monetary policy normalization in H2 2023.
- The 5-month rally of USD/JPY is now coming close to key short-term resistance at 141.00.
This week’s latest release of key leading economic data out of Japan has indicated signs of sustained inflationary growth and a recovery in demand that could boost economic growth in the second half of 2023.
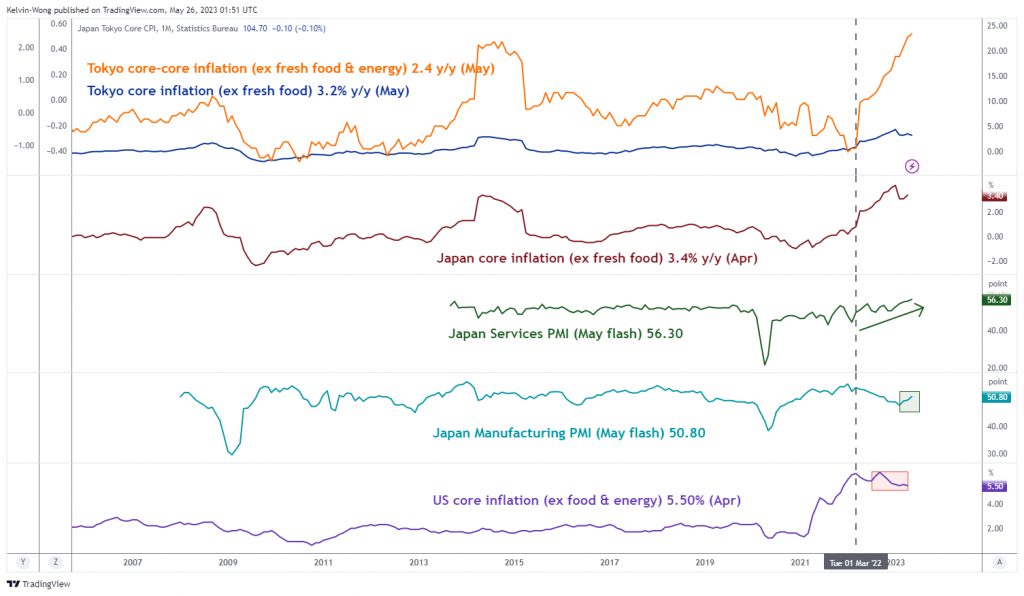
The May flash manufacturing purchasing managers’ index (PMI) has increased to an eight-month high of 50.8 from 49.5 printed in April and exited from a contraction mode. Likewise, the services PMI has shown signs of resilience, increasing to 56.3 in May from 55.4 in April, its ninth consecutive month of growth expansion.
Tokyo (excluding fresh food & energy) CPI for May accelerated to a 31-year high
Fig 1: Tokyo inflation, Japan manufacturing & services PMIs for May 2023 (Source: TradingView, click to enlarge chart)
Tokyo consumer inflation data for May, a leading indicator for Japan’s nationwide price trends grew at a slower pace of 3.2% year-on-year for its core component (excluding fresh food) from an increase of 3.5% in April, slightly below the consensus forecast of 3.3%. But it has surpassed the Bank of Japan’s (BoJ) 2% inflation target for twelve consecutive months.
In addition, the Tokyo core-core inflation (excluding fresh food and energy), a measurement of sticky inflationary pressure is on a path of acceleration where it rose to 2.4% year-on-year, its highest level in almost 31 years from a gain of 2.3% recorded in April.
Thus, this latest set of upbeat leading economic data has further opened the “window of opportunity” for BoJ not to “drag its feet” to normalize its current ultra-easy monetary policy in 2023 amid rising global interest rates.
BoJ is playing a “Game of Thrones” with speculators
The latest public speeches and guidance made by the new BoJ Governor Kazuo Ueda have been less direct and clear in terms of the type of economic data and variables that BoJ is watching for it to be more confident to bring forward monetary policy normalization.
Yesterday, 25 May, Ueda in his first group media interview indicated a shift on its “core data watchlist”; stated that wage growth in Japan was not a sole target to determine the setting of BoJ’s monetary policy and the key point was whether inflation would rise in a stable and sustainable manner at 2%.
This latest remark from Ueda has played down the importance of wage growth, a reversal in April when Ueda chaired his first monetary policy meeting that highlighted wage growth as BoJ’s new policy guidance; as wage growth is still lacklustre, this prior guidance has generated some form of expectations that BoJ will be more patient in changing course, wait for more clear signs of upward momentum in wage growth and wait until the results of next year spring’s wages negotiation before it decides to normalize its accommodative monetary policy.
It seems that BoJ does not want to give clear-cut guidance of its monetary policy to prevent speculators from timing its exit from negative interest rates and its Yield Curve Control programme (YCC) on the yield of the 10-year Japanese Government Bond (JGB). Hence, an element of surprise needs to be implemented to prevent a significant spike in the JGBs yields that can trigger a massive bond selloff in the financial markets reinforced by microstructure risk in terms of liquidity absorption where BoJ has owned a record of 52% of outstanding JGBs as of end December 2022.
Net foreign inflow into the Japanese equities for the eighth consecutive week
Meanwhile, the Japanese stock market has roared back to life, the benchmark Nikkei 225 has recorded a month-to-day return of +7.10% for May at this time of the writing and surpassed its previous major swing high of 30,715 printed on February 2021.
It has also outperformed the MSCI All-Country World Index on a year-to-date basis; 18.5% versus 7.8%. These positive observations have led to significant foreign inflows into the Japanese stock market. Net buying by foreign investors totalled 747.6 billion yen between 15 May 15 and 19 May, up 32% from the previous week. This extended the streak into an eighth week, the longest since June 2017. A net amount of 3.6 trillion yen in stock was purchased over that period, the largest eight-week sum in nearly a decade.
In our previous analysis dated 19 April, we have highlighted the key supporting factors that may see a persistent tactical outperformance of the Japanese stock market into the second half of 2023 (click here for a recap).
Overall, the improving economic backdrop in Japan with accelerating sticky inflation coupled with a buoyant stock market that is supported by foreign net inflows has opened a window of opportunity for BoJ to normalize its ultra-easy monetary policy at least via a further widening of the YCC band in the first step, perhaps in July when it publishes its latest quarterly outlook report that comes with its latest projections of inflation and economic growth trend.
USD/JPY Technical Analysis – Below key 141.00 short-term resistance with exhaustion elements
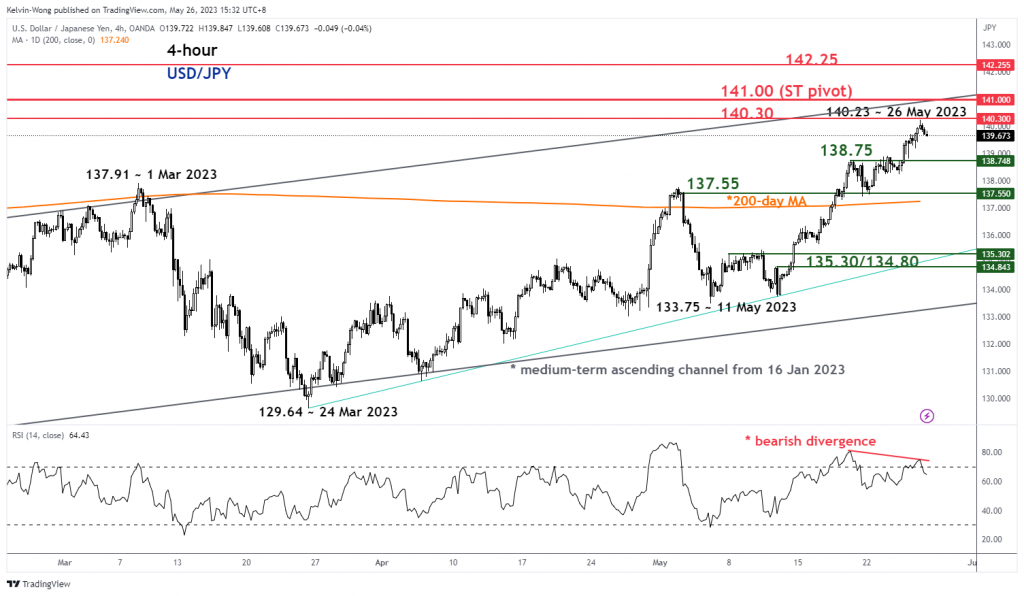
Fig 2: USD/JPY trend as of 26 May 2023 (Source: TradingView, click to enlarge chart)
In the recent week, the USD/JPY has rallied to its highest level so far seen this year, printing an intraday high of 140.23 during yesterday, 25 May US session.
Interestingly, the 5-month up move from its 16 January 2023 low of 127.22 is now coming close to the upper boundary of an ascending channel now acting as a resistance at around 141.00. The upside momentum of the most recent up move from the 11 May 2023 low of 133.75 is showing signs of exhaustion as the 4-hour RSI oscillator has just flashed out a bearish divergence signal at its overbought region.
Hence, the USD/JPY is now at risk of at least a short-term bearish reversal below the 141.00 key short-term pivotal resistance with the next supports coming in at 138.75 and 137.55 (also confluences with the 200-day moving average).
However, a clearance above 141.00 sees the next resistance at 142.25 which is defined by the 61.8% Fibonacci retracement of the prior major down move from the 21 October 22 high to the 16 January 2023 low and the swing high area of 21/22 November 2022
Content is for general information purposes only. It is not investment advice or a solution to buy or sell securities. Opinions are the authors; not necessarily that of OANDA Business Information & Services, Inc. or any of its affiliates, subsidiaries, officers or directors. If you would like to reproduce or redistribute any of the content found on MarketPulse, an award winning forex, commodities and global indices analysis and news site service produced by OANDA Business Information & Services, Inc., please access the RSS feed or contact us at info@marketpulse.com. Visit https://www.marketpulse.com/ to find out more about the beat of the global markets. © 2023 OANDA Business Information & Services Inc.


