- Canada CPI and BOC Overnight Rate schedule
- Technical Analysis for Monthly, Daily, and 4-hour charts
The Canadian Dollar opened 2024 with a decline against the US Dollar, the Forex pair USD/CAD rose from 1.3180 in late December 2023 to its current average price of 1.3380 and has been trading near this level for a few days. The pair held steady throughout the US CPI data release as well as the recent upside move in oil prices. Next week, markets are looking forward to December’s 2023 CPI data from Canada, the previous median CPI y/y was 3.4%, and the m/m was 0.1%. Traders will be watching the CPI data closely as the release is scheduled ahead of the Bank of Canada Monetary Policy Report, Overnight Rate, and Rate Statement scheduled on the morning of January 24th, 2024 local time. It is also important to bear in mind the potential risks that may arise due to the recent developments in the Middle East and its potential impact on Oil Prices.
Monthly Chart
- Price action continues to trade within its long-term trading range established in 2015, price is currently at mid-range (Rectangular area), however, price action is still finding support above the ascending trendline established in mid-2021. (Blue line)
- Negative divergence between price action and RSI indicator (Red lines), price action made higher highs while RSI plotted a lower high for the same move. Although RSI is moving towards its oversold territory, it remains near the indicator’s neutral level.
- Price action continues to trade below its EMA9 which intersects with the annual pivot point of 1.3410, price attempted to break above this level in January but has been unsuccessful so far. On the other hand, price action remains above its SMA50 which intersects with the ascending blue trendline.
Daily Chart
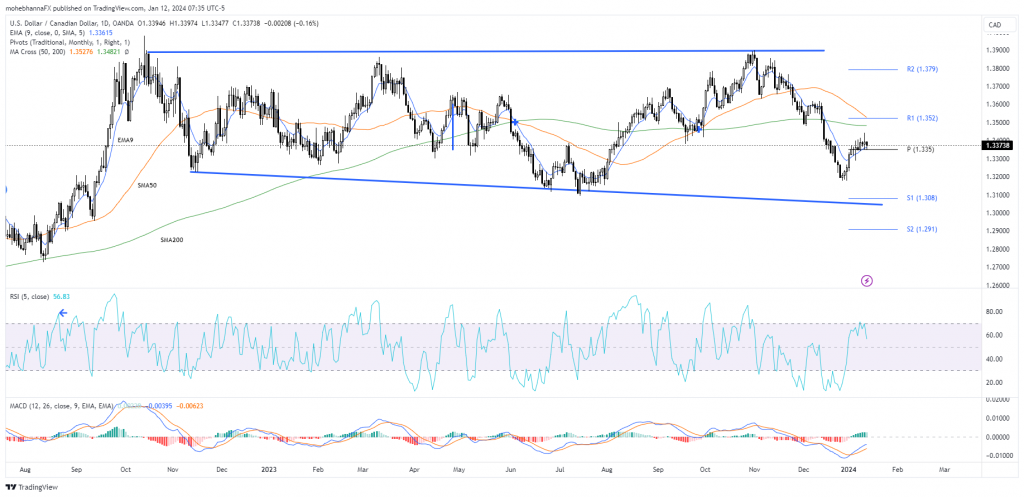
- Price action continues to trade within its 2023 trading range, and is at mid-range, the same as the monthly chart.
- Price is trading below its SMA 50 and SMA 200, however, it recently found support above its EMA9 and has been trading above its monthly pivot point of 1.3350 for a few days so far.
- RSI is within its overbought level, inline with recent price action, while MACD line crossed above its signal line.
4-Hour Chart
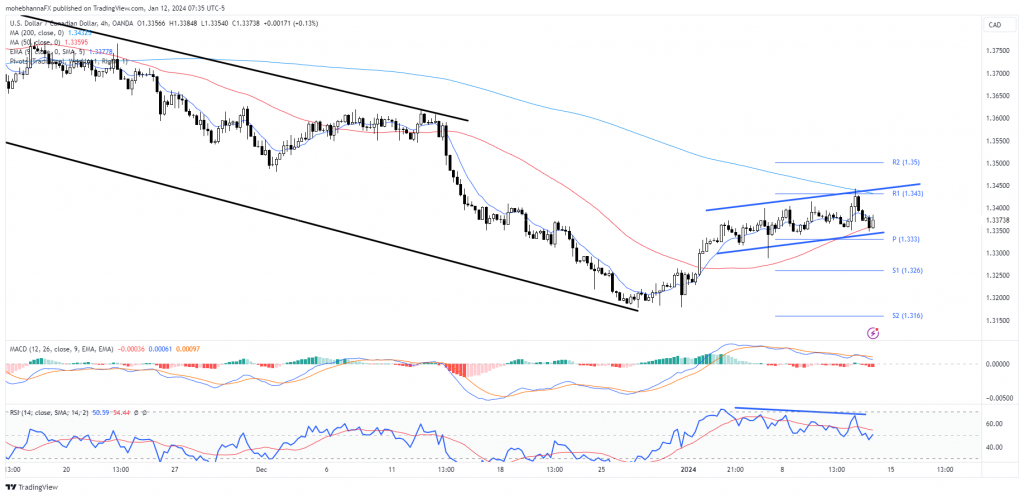
- Price was trading within a descending channel and currently appears to be attempting to complete a rising wedge formation. If price action breaks below and continues to trade below the wedge pattern, it can be considered a continuation pattern for the descending channel.
- The same wedge pattern is also accompanied by a negative divergence on RSI.
- The MACD line is reflecting a negative divergence and the MACD line just crossed below the signal line
Content is for general information purposes only. It is not investment advice or a solution to buy or sell securities. Opinions are the authors; not necessarily that of OANDA Business Information & Services, Inc. or any of its affiliates, subsidiaries, officers or directors. If you would like to reproduce or redistribute any of the content found on MarketPulse, an award winning forex, commodities and global indices analysis and news site service produced by OANDA Business Information & Services, Inc., please access the RSS feed or contact us at info@marketpulse.com. Visit https://www.marketpulse.com/ to find out more about the beat of the global markets. © 2023 OANDA Business Information & Services Inc.


