- USD/CAD is approaching a crucial support zone above 1.3600 ahead of Canadian inflation data.
- The Loonie has strengthened recently due to rising oil prices and USD weakness.
- Upcoming Canadian inflation and retail sales data, along with Fed policymakers’ statements, will be crucial for USD/CAD’s direction.
Most Read: Gold (XAU/USD) Eyes Consolidation Above $2500/oz. Will Bulls Hold the Line?
USD/CAD has approached a crucial support zone just above the 1.3600 level in anticipation of tomorrow’s Canadian inflation data. The Loonie has gained in recent weeks due to rising WTI oil prices and significant USD weakness.
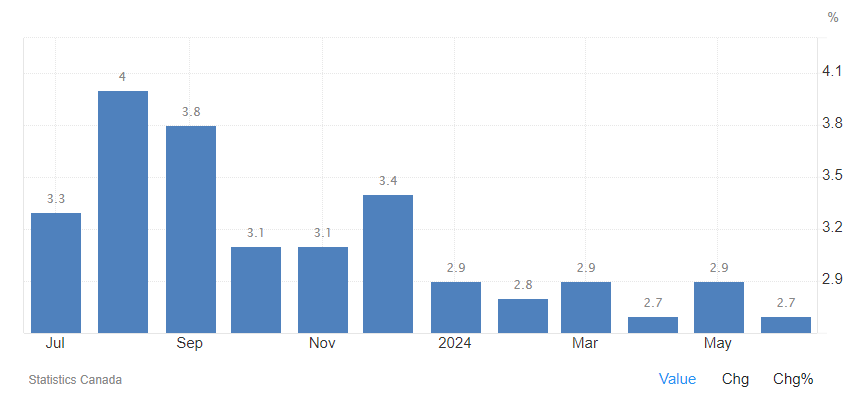
The Canadian economy has been under the microscope over the past few months, experiencing signs of stagnation. This period saw a rise in unemployment, although inflation has eased to the latest year-over-year figure of around 2.7%, matching the year’s lowest print.
Inflation Rate YoY
Source: TradingEconomics
Considering the increased unemployment rate and the decline in retail sales, among other data points, the Bank of Canada (BoC) will be keen to prevent an inflation uptick. Such an event would complicate matters further for the Canadian Central Bank, which has already reduced rates by 50 basis points this cycle and may cut more if economic growth remains sluggish.
Therefore, avoiding an inflation rise will likely be a top priority for the BoC before the next Central Bank meeting.
Canadian Inflation and Retail Sales Data Ahead
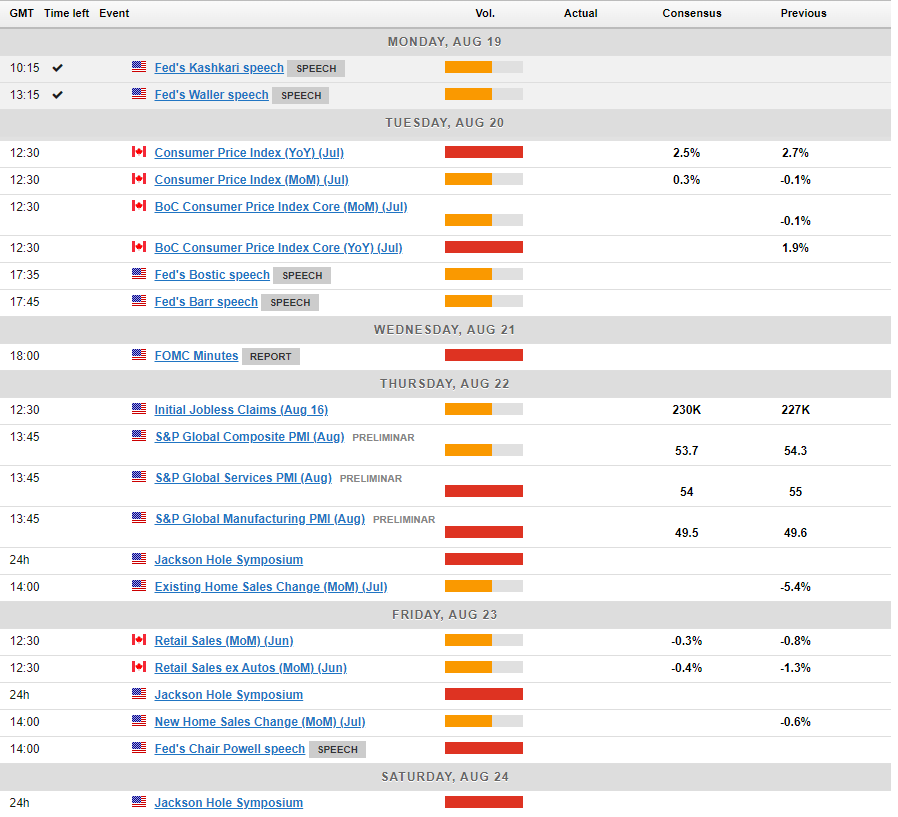
Canadian inflation data is set to be released tomorrow, followed by statements from several Federal Reserve policymakers. The recent dovish stance from Fed officials has pressured the US Dollar since Friday, continuing into today’s session with the DXY hitting new lows.
Friday’s retail sales data will be equally crucial, especially since the poor May figures raised fears of a potential recession. The Bank of Canada is hoping for a notable improvement in June as the impact of rate cuts begins to manifest.
Source: For all market-moving economic releases and events, see the MarketPulse Economic Calendar. (click to enlarge)
Technical Analysis
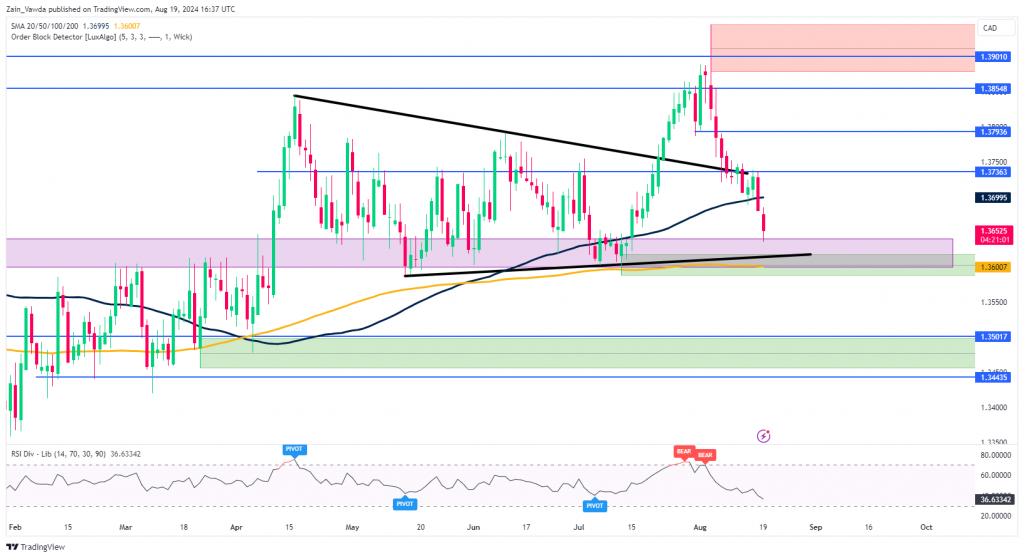
From a technical standpoint, USD/CAD has experienced a sharp decline from the August 5th high of around 1.3900. The descent has been accelerated by fundamental data and the evolving rate cut environment, pushing USD/CAD down more rapidly than usual.
A wedge pattern was breached when the price broke through the 1.3900 level, but the lower boundary of this wedge aligns with a crucial support zone near the 1.3600 mark.
Additionally, the 200-day moving average is situated around this level, creating a significant confluence zone that is theoretically expected to offer support.
Tomorrow’s inflation data could drive the pair in either direction, depending on the outcome, while the DXY will also play a pivotal role in determining the next move for USD/CAD.
USD/CAD Chart, August 19, 2024
Source: TradingView (click to enlarge)
Support
- 1.3600
- 1.3550
- 1.3500
Resistance
- 1.3699 (100-day MA)
- 1.3736
- 1.3790
Follow Zain on Twitter/X for Additional Market News and Insights @zvawda
Content is for general information purposes only. It is not investment advice or a solution to buy or sell securities. Opinions are the authors; not necessarily that of OANDA Business Information & Services, Inc. or any of its affiliates, subsidiaries, officers or directors. If you would like to reproduce or redistribute any of the content found on MarketPulse, an award winning forex, commodities and global indices analysis and news site service produced by OANDA Business Information & Services, Inc., please access the RSS feed or contact us at info@marketpulse.com. Visit https://www.marketpulse.com/ to find out more about the beat of the global markets. © 2023 OANDA Business Information & Services Inc.


