- BoJ hiked its overnight interest rate to 0.25% and announced its “Quantitative Tightening” plan, without much major surprises.
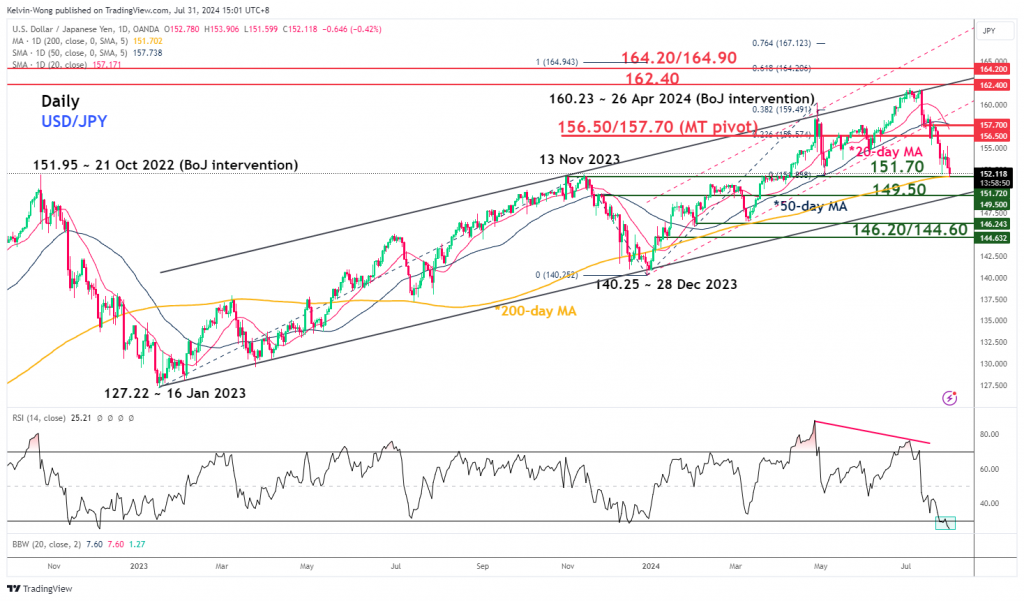
- USD/JPY sold off but still hovering above its 151.70 key short-term support.
- Cannot rule out the possibility of another minor mean reversion rebound in USD/JPY before a bearish impulsive down move sequence unfolds with next medium-term support supports coming in at 149.50 and 146.20/144.60.
This is a follow-up analysis of our prior report, “USD/JPY Technical: Potential mean reversion rebound in progress above 200-day MA” published on 29 July 2024. Click here for a recap.
Since our last publication, the USD/JPY has shaped the expected mean reversion rebound right above the 151.70 key pivotal support and rallied to hit an intraday high of 155.22 on Tuesday, 30 July, just a whisker away from the lower boundary of the short-term mean reversion rebound resistance zone of 155.80/156.50.
Thereafter, the Japanese yen started to strengthen against the US dollar as the USD/JPY shaped an intraday decline of 1.6%/245 pips to close Tuesday, 30 July US session at 152.76. The reason for this abrupt intraday decline has been a “breaking news” release from a Japanese media outlet that stated Bank of Japan (BoJ) was considering an interest rate hike today to increase its overnight policy interest rate to 0.25% from 0% to 0.1% ahead of today’s BoJ monetary policy decision.
BoJ does not surprise (again) and maintained its inflation trend outlook
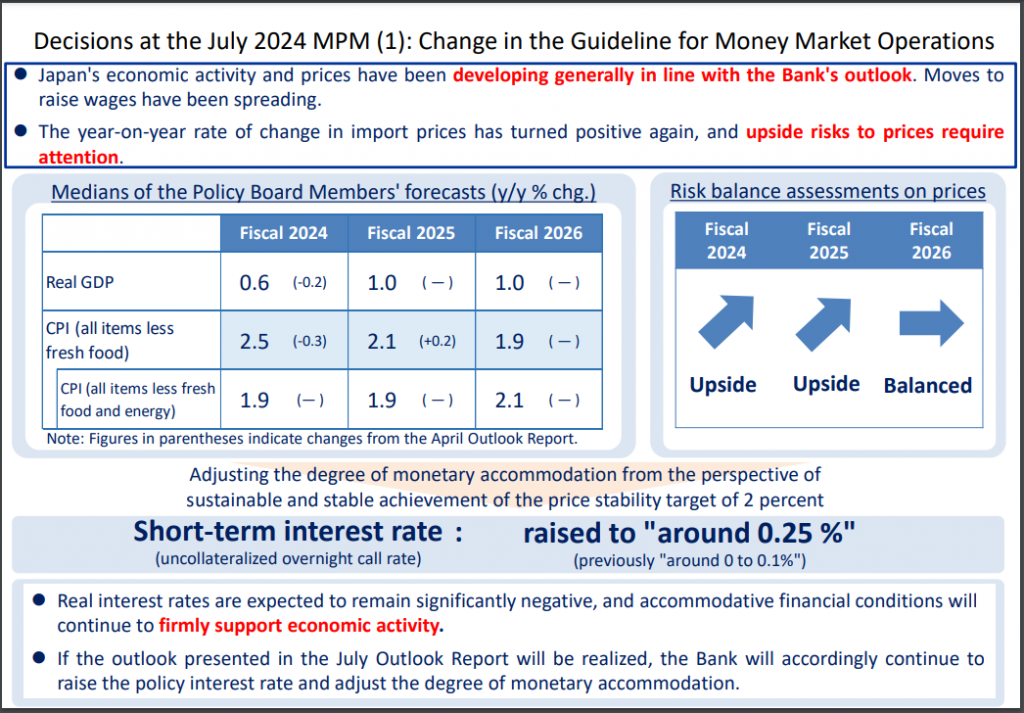
Fig 1: BoJ monetary policy decision and latest quarterly outlook as of 31 Jul 2024 (Source: BoJ website, click to enlarge chart)
These type of “breaking news” leaks ahead of key BoJ’s monetary policy decision seems to be a “modus operandi” to prep markets and reduces the risk of high volatility moments inflicted on the global markets via the process of messy unwinding of positions that can trigger significant feedback loops in difference cross assets when the actual announcement takes place; a similar approach was utilized in March when BoJ abolished its “yield curve control” programme on the 10-year Japan Government Bond (JGB) yield and increase its overnight interest rate from a negative level; its first hike since 2007.
The USD/JPY dropped further to test the 151.70 key support (printed an intraday low of 51.60) right after the BoJ’s monetary policy announcement to hike its overnight interest rate for the second time this year and managed to stage a bounce thereafter to print an ex-post BoJ session intraday high of 153.90 at this time of the writing.
In addition, BoJ’s latest quarterly outlook on inflationary trend in Japan remained the same as the previous April quarter where officials maintained their median forecasts for core-core CPI (excluded fresh food and energy) at 1.9% for fiscal years of 2024 to 2025 and 2.1% for fiscal year of 2026 (see Fig 1).
BoJ has expressed concerns on imported inflation where upside risks for import prices have increased for fiscal years of 2024 and 2025 on a year-on-year rate of change basis (see Fig 1) which in turns suggest that that on a medium-term horizon, BoJ has implied indirectly that a further Japanese yen weakness is not desirable as its adverse effects on consumer confidence and spending outweighs its benefits. That’s a likely driver to see a further weakening of the USD/JPY in the medium-term horizon.
Gradual quarterly reduction of JGBs monthly purchases
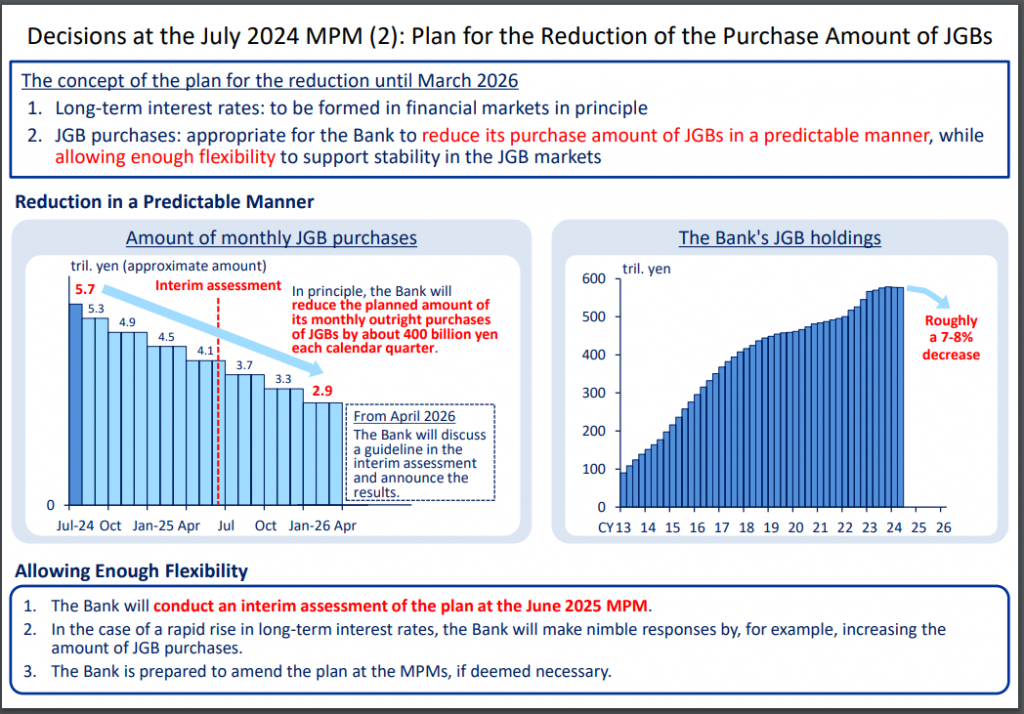
Fig 2: BoJ plan for the reduction of JGBs monthly purchases as of 31 Jul 2024 (Source: BoJ website, click to enlarge chart)
Also, without any major surprise, BoJ has “officially” announced its “Quantitative Tightening” programme to reduce its monthly JGBs purchase of 5.7 trillion yen by 50 percent to around 3 trillion yen by Q1 2026 through gradual reduction by about 400 billion yen each calendar quarter (see Fig 2).
This process is likely to see a decrease of around 7% to 8% in the current huge JGBs holdings that is coming close to 600 trillion yen in BoJ’s balance sheet and allow market forces to play a more significant role in the determination of long-term interest rates in Japan.
Overall, also a medium-term factor that may led to lower levels of USD/JPY going forward.
Technical factors are supporting of a minor mean reversion rebound within a medium-term downtrend in USD/JPY
Fig 3: USD/JPY medium-term & major trend phases as of 31 Jul 2024 (Source: TradingView, click to enlarge chart)
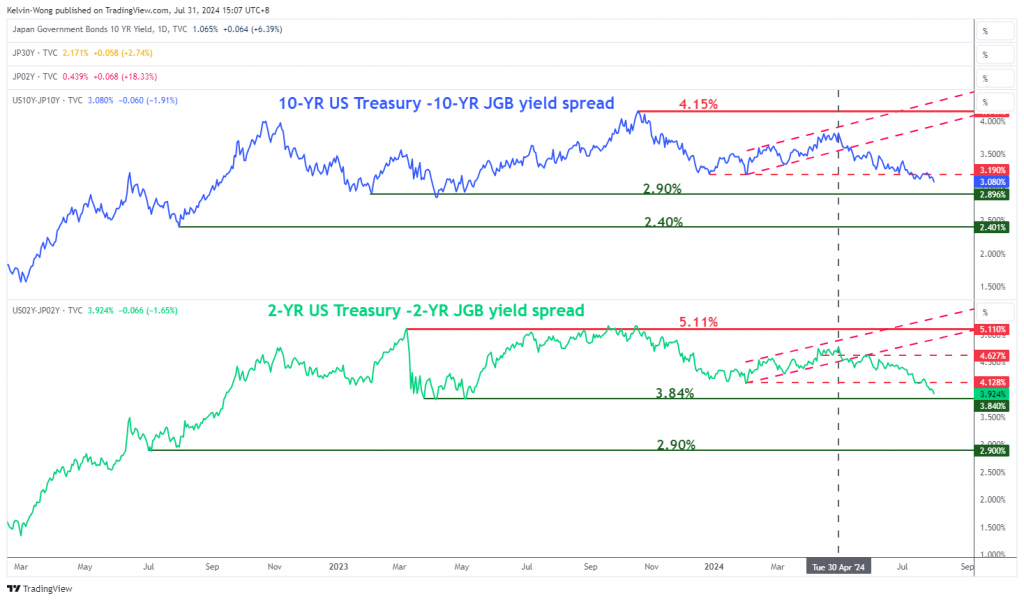
Fig 4: US Treasuries-JGBs yield spreads medium-term trend as of 31 Jul 2024 (Source: TradingView, click to enlarge chart)
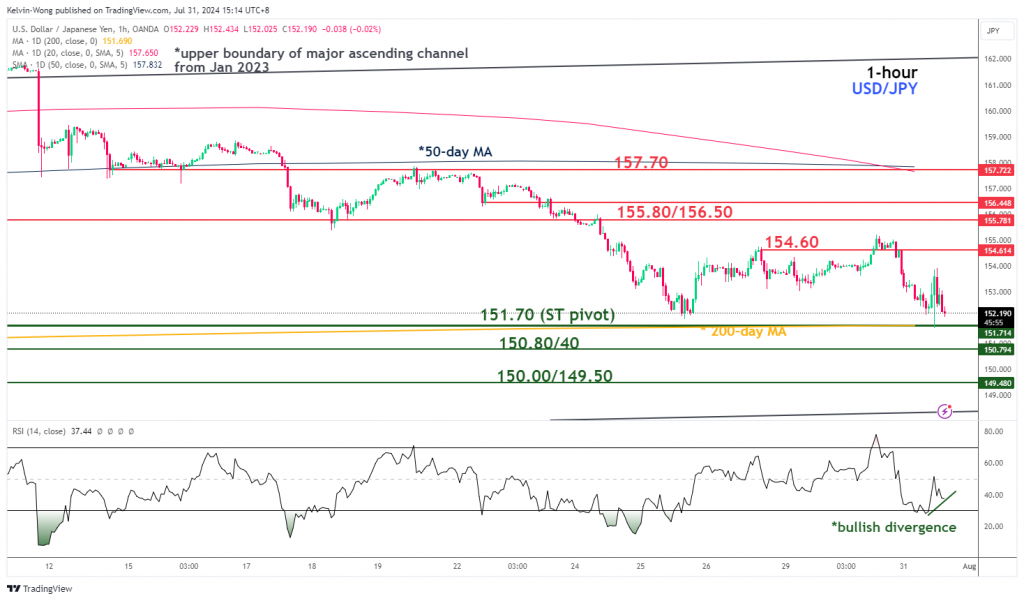
Fig 5: USD/JPY short-term trend as of 31 Jul 2024 (Source: TradingView, click to enlarge chart)
In the lens of technical analysis, price actions of highly liquid tradable financial instruments do not move in a vertical fashion but oscillate within longer-term trend phases.
At this juncture as seen on the daily chart of the USD/JPY, the medium-term trend of the USD/JPY has turned bearish as it has broken below its 50-day moving average recently on 17 July after it held prior dips in price actions since 14 March 2024 (see Fig 3).
In addition, the positive yield premium (2-year and 10-year) of US Treasuries over JGBs have continued to shrink with in turns supports the medium-term downtrend of USD/JPY from unfolding with the next medium-term supports coming in at 149.50 and 146.20/144.60 (see Fig 4).
The on-going slide in the USD/JPY (20 days so far) in place its 03 July 2024 high of 161.95 has reached an oversold condition on the daily RSI momentum indicator.
Coupled with a potential bullish divergence condition being flashed out on the hourly RSI momentum at its oversold region after a test on the 151.70 key short-term pivotal support (also the 200-day moving average), we cannot rule out another leg of minor reversion rebound scenario to occur, a clearance above 154.60 near-term resistance may see an extension of the rebound to expose the 155.80/156.50 resistance zone before another bearish impulsive downmove sequence unfolds (see Fig 5).
Content is for general information purposes only. It is not investment advice or a solution to buy or sell securities. Opinions are the authors; not necessarily that of OANDA Business Information & Services, Inc. or any of its affiliates, subsidiaries, officers or directors. If you would like to reproduce or redistribute any of the content found on MarketPulse, an award winning forex, commodities and global indices analysis and news site service produced by OANDA Business Information & Services, Inc., please access the RSS feed or contact us at info@marketpulse.com. Visit https://www.marketpulse.com/ to find out more about the beat of the global markets. © 2023 OANDA Business Information & Services Inc.


