- The USD/JPY has traded higher in the past 7 sessions and printed an intraday high of 159.85 last Friday, 21 June which coincided with its 34-year high of 160.23 printed on 26 April.
- Last week’s persistent JPY weakness prompted Japan’s Ministry of Finance Vice Minister-in-charge of the FX market to issue a “firmer” verbal intervention.
- The current upmove of USD/JPY is more orderly rather than excessive which may not trigger an actual FX intervention from MoF.
- Watch the key medium-term support of 156.50 on the USD/JPY.
- The key first medium-term resistance zone of USD/JPY is at 161.10/162.40 also coincides with the potential “excessive threshold” levels of 161.85/95.
This is a follow-up analysis of our prior report, “USD/JPY: JPY cross pairs may get smacked down by higher JGB yields” published on 30 May 2024. Click here for a recap.
The USD/JPY and other G-10 Japanese yen crosses have staged only a minor decline and managed to hold above their respective 50-day moving averages as support zones on in early June before being propelled higher.
G-10 yen crosses traded higher since mid-June
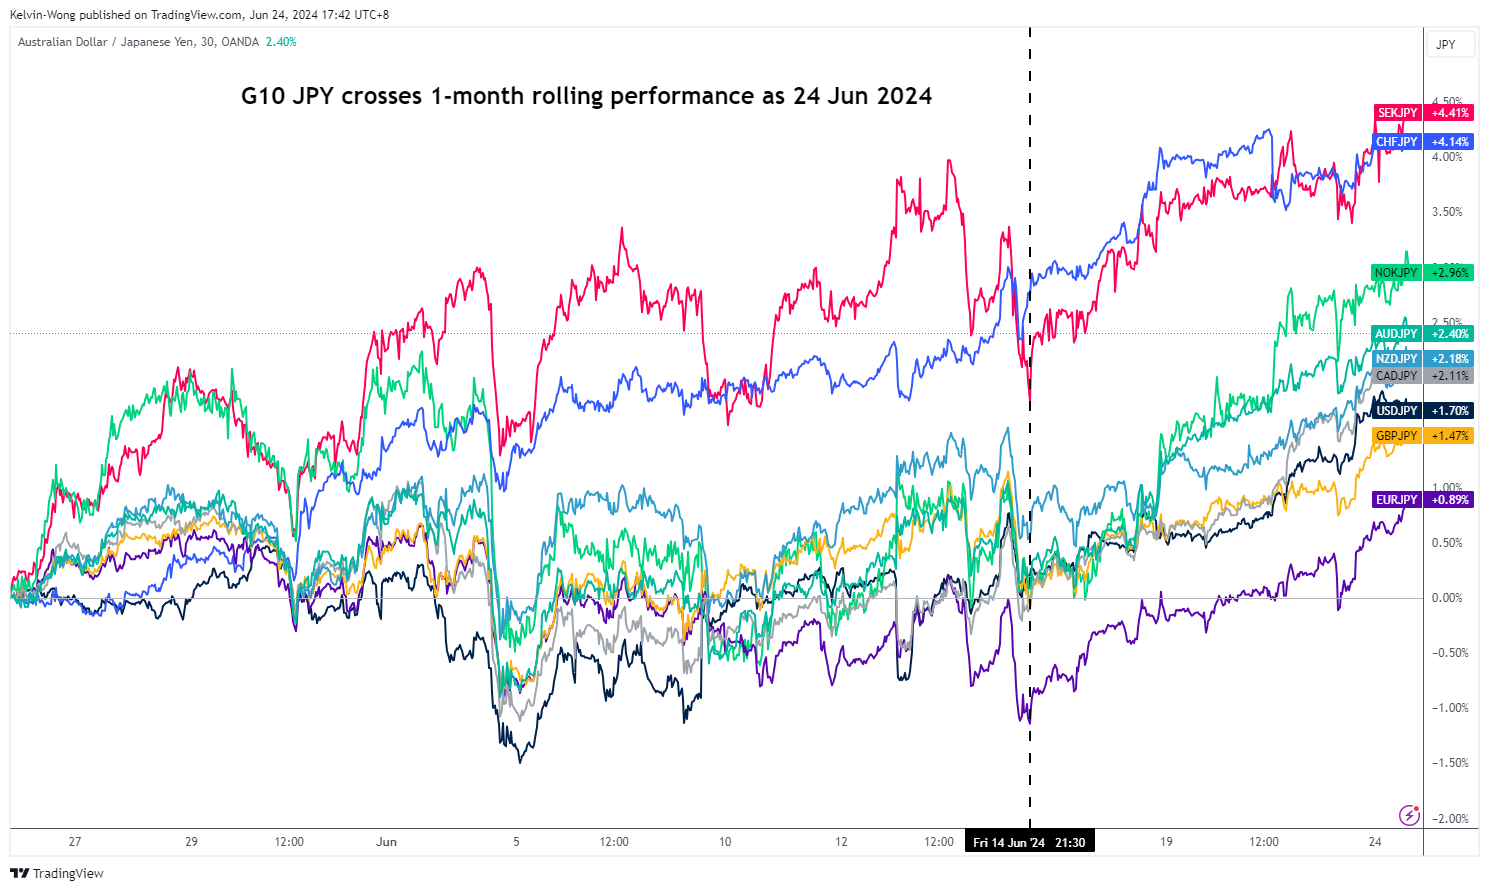
Fig 1: 1-month of rolling performances of G-10 JPY crosses as of 24 Jun 2024 (Source: TradingView, click to enlarge chart)
Since 13 June, the USD/JPY has had seven consecutive sessions of higher daily closes, and it continued its march northwards to print an intraday high of 159.85 last Friday, 21 June just a whisker away from its 34-year high of 160.23 hit on 29 April that triggered a record amount of US$62.2 billion in FX intervention by Bank of Japan (BoJ) to prop up the yen for the period between 26 April to 29 May.
Last week, the drop in the JPY was accompanied by a backdrop of lackluster key Japan economic data; a continuation of demand-driven core-core inflation (excluding fresh food and energy) deceleration to 2.1% y/y in May, its lowest pace of increase since September 2022 from 2.4% y/y in April. Also, services activities, one of the key sources of growth engine in Japan for the past two years have contracted for the first time since August 2022 where the preliminary Jibun Bank Japan Services PMI slipped to 49.8 in June from 53.8 in May.
These softer prints of Japanese economic data may prompt BoJ to delay its next interest rate hike to September coupled with the near-term uptick in geopolitical risk premium coming out from the Eurozone due to the looming first round of French legislative elections scheduled this Sunday, 30 June that support potential bids on the US dollar due to safe-haven demand.
“Firmer” verbal intervention from the Ministry of Finance
Last week’s persistent weakness inflicted on the JPY ahead of two related risk events this week; the first round of the French legislative elections outcome over the weekend as well as this Friday, 28 June release of US PCE inflation data for May has prompted, Japan top currency official, MoF Vice Finance Minister Kanda to issue a firmly worded verbal intervention in today’s early Asian session that stated Japan can intervene in the FX market, 24 hours a day if needed in the event of excessive moves based on speculations.
So far, there are no significant movements in the USD/JPY as it continued to trade in a tight intraday range of 30 pips, closer to last Friday, 21 June high of 159.85; quoted at 159.70 at this time of the writing.
The recent movements of the USD/JPY weakness seem more “orderly” than “excessive”
Earlier this year, a public speech made by MoF Vice Finance Minister Kanda implied an excessive movement in the USD/JPY was either a 10-yen big figure drop over a month or a 4% drop in about two weeks.
Hence, the potential “excessive” threshold levels to watch are likely at 161.85 (using the month of May’s USD/JPY intraday low of 151.85), and 161.95 (based on a 2-week rolling +4% measurement on the USD/JPY from its intra-week low of 155.72 for the week of 10 June).
Daily RSI momentum has not reached an extreme overbought level
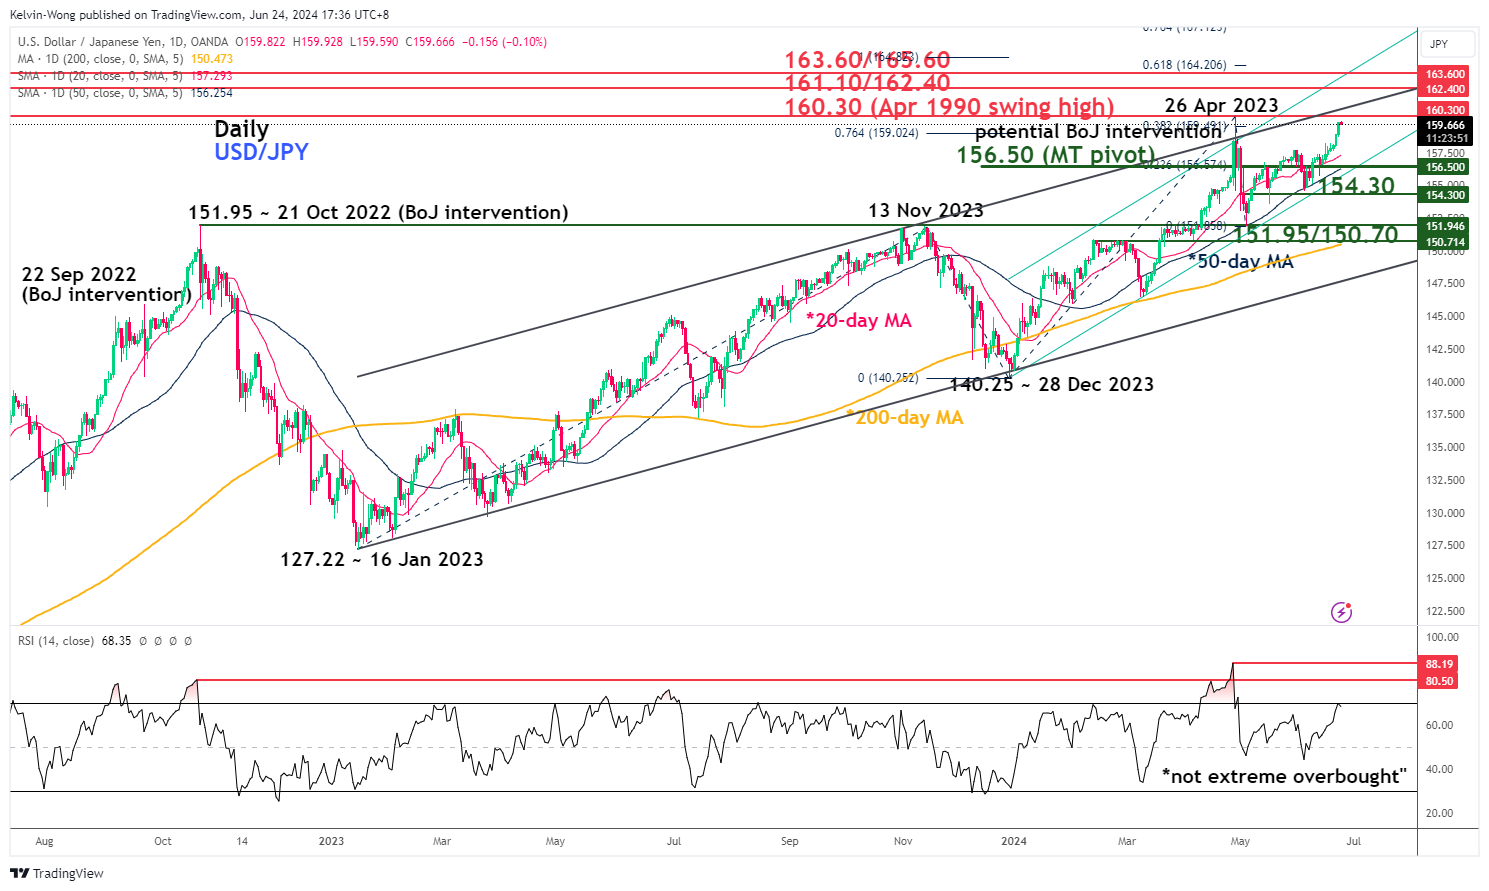
Fig 2: USD/JPY medium-term & major trends as of 24 Jun 2024 (Source: TradingView, click to enlarge chart)
In the lens of technical analysis, the current upmove of the USD/JPYUY from its 4 June low of 154.55 has not led it to an extreme overbought level as highlighted by the daily RSI momentum indicator.
The daily RSI is now hovering at around the 68 level which is still below the key extreme overbought zone of 80.50/88.10 hit previously where it coincided with the prior FX Interventions to strengthen the yen on 21 October 2022 and most recently, the suspected one on 26 April.
Overall, the major and medium-term uptrend phases remain intact with key medium-term pivotal support at 156.50 (also the rising 50-day moving average). A clearance above 160.30 sees the next medium-term resistance zone to come in at 161.10/162.40 also coincides with the potential “excessive threshold” levels of 161.85/95.
On the other hand, a break below 156.50 damages the medium-term uptrend for a potentially steeper corrective decline move within its major uptrend phase to expose the next support at 154.30, and below it may see the major support zone of 151.95/150.70 (also the 200-day moving average).
Content is for general information purposes only. It is not investment advice or a solution to buy or sell securities. Opinions are the authors; not necessarily that of OANDA Business Information & Services, Inc. or any of its affiliates, subsidiaries, officers or directors. If you would like to reproduce or redistribute any of the content found on MarketPulse, an award winning forex, commodities and global indices analysis and news site service produced by OANDA Business Information & Services, Inc., please access the RSS feed or contact us at info@marketpulse.com. Visit https://www.marketpulse.com/ to find out more about the beat of the global markets. © 2023 OANDA Business Information & Services Inc.

Kelvin Wong
Passionate about connecting the dots in the financial markets and sharing perspectives around trading and investment, Kelvin Wong is an expert in using a unique combination of fundamental and technical analyses, specializing in Elliott Wave and fund flow positioning, to pinpoint key reversal levels in the financial markets.
In addition, over the last ten years, Kelvin has conducted numerous market outlook and trading-related seminars, as well as technical analysis training courses, for thousands of retail traders.
Latest posts by Kelvin Wong (see all)
- Nasdaq 100 Technical: At risk of staging a multi-week corrective decline - 20 December 2024
- Gold Technical: A less dovish Fed may reinforce a medium-term corrective decline - 16 December 2024
- AUD/USD: Surviving at the 0.6360 key support (for now) but the long-term trend remains bearish - 13 December 2024