- The GBP has been declining against the USD due to softer-than-expected UK economic data, leading to expectations of more aggressive rate cuts by the Bank of England.
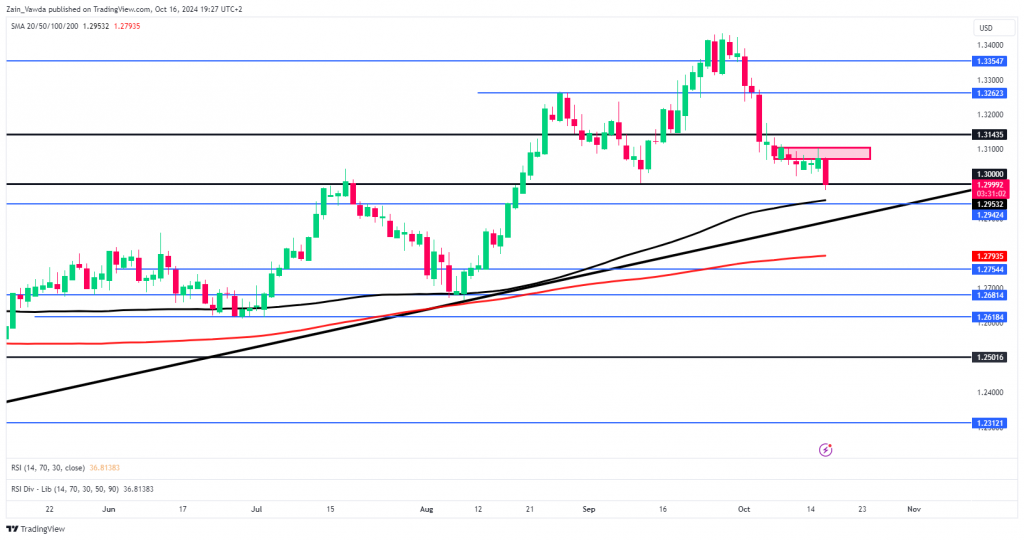
- GBP/USD is at a crucial level of 1.3000, a break below which could lead to further downside.
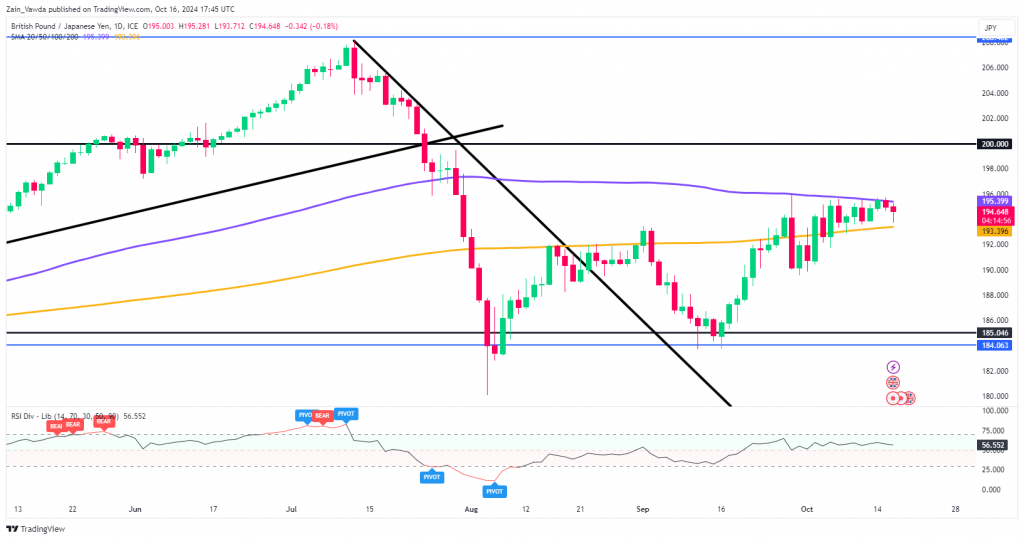
- GBP/JPY is showing signs of a potential breakout, with price coiling between the 100 and 200-day moving averages.
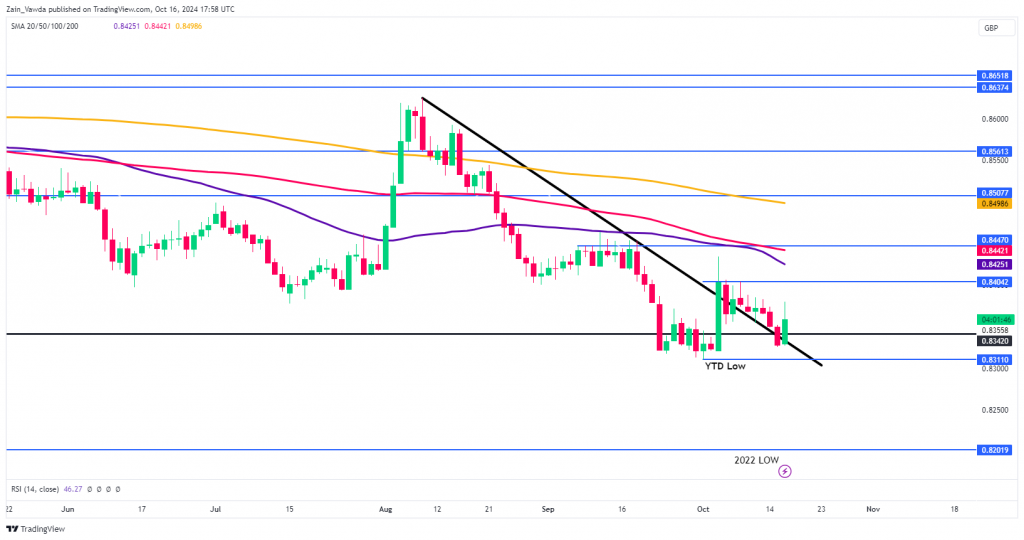
- EUR/GBP is near the YTD low, with immediate resistance at 0.8400. The pair’s future direction will depend on the GBP’s strength and the ECB’s decision.
Most Read: US Dollar Index (DXY) Outlook: DXY Breaches the 100-day MA, Will the Rally Continue?
The GBP has steadily declined against the greenback in recent weeks, while remaining stable against the Euro. This weakness in the British pound is attributed to market participants pricing in more aggressive rate cuts due to softer-than-expected data.
The Euro meanwhile continues to engage in a tug of war with the GBP but appears to be winning at present, much to my surprise. The JPY yen has been the major loser of late, unable to capitalize on GBP weakness. GBP/JPY continues to inch higher as there remains weakness in the Japanese Yen ahead of the election at the end of the month.
UK Inflation Data Surprise
This morning the UK’s Office for National Statistics released a mild Consumer Price Index (CPI) report for September. It showed that annual inflation dropped to 1.7%. While prices were expected to slow down, they were predicted to decrease to 1.9% from 2.2% in August. Monthly inflation stayed the same.
The most important print however came from services inflation which has been a sticky point for the Bank of England. According to the ONS, services inflation dropped more than expected, from 5.6% to 4.9%. This was not only below what experts predicted but also much lower than the Bank of England’s forecast of 5.5%. This softer result could lead to more interest rate cuts in the upcoming Bank of England meetings this year.
All is not lost for the UK and the Pound as the Bank of England are still priced in to cut rates at around the same pace as the Federal Reserve. Initially the pound had been benefitting from the potential of rate divergence with the US Dollar in particular, however any such hopes appear to have been dashed following the latest UK inflation report.
Technical Analysis
GBP/USD
From a technical standpoint, GBP/USD is at a very important level with the 1.3000 psychological level in play. A daily candle close below this level could open up further downside for the pair.
A daily candle close below the 1.3000 will face support around the 1.2950 handle which an area of confluence which houses the 100-day MA. Below this we do have the long term ascending trendline as well which could come into play for the first time since the previous touch on August 8.
There are two scenarios that could develop in the day/days ahead. The first one being a bounce of the 100-day MA and a retest of the 1.3000 or potentially the 1.3100 handle (pink box on the chart) before the downtrend continues.
The second scenario, is a continued selloff until a touch of the trendline before a bounce occurs. At this stage both of these events are plausible as I do not see enough bearish pressure for a clean break of the ascending trendline at this stage. Now I could be wrong and we of course may break through the trendline as well, but I believe such a move may require a catalyst of sorts before it materializes.
Support
- 1.2950 (100-day MA)
- 1.2900
- 1.2793 (200-day MA)
Resistance
- 1.3040
- 1.3100
- 1.3143
GBP/USD Daily Chart, October 16, 2024
Source: TradingView.com (click to enlarge)
GBP/JPY
GBP/JPY has been inching its way higher since bottoming out on August 5. There was another push down to the mid 180s on September 16 before the move higher began once more.
GBP/JPY appears poised for a breakout after looking at recent price action. Price has been coiling between the 100 and 200-day MA since October 4. Usually when price is constricted in such a way, the longer the breakout takes the more aggressive it is.
On a daily timeframe a break and daily candle close below the 190.00 lower swing high would invalidate the bullish trend.
For now though a break to the upside seems more plausible based on price action and the overall trend.
GBP/JPY Daily Chart, October 16, 2024
Source: TradingView.com (click to enlarge)
Support
- 193.40 (200-day MA)
- 190.00
- 187.60
Resistance
- 195.40 (100-day MA)
- 198.00
- 200.00
EUR/GBP
EUR/GBP remains near the YTD low around the 0.8300 handle. The pair is enjoying a bullish bounce today but there does appear to be significant technical hurdles if the GBP is to lose more ground to the Euro.
Immediate resistance rests at 0.8400 with a key area of confluence resting just above. The region between 0.8425-0.8450 plays host to the 50 and 100-day MAs as well as the most recent swing high.
Conversely, should the GBP strengthen in light of the ECB decision on Thursday then the 2022 lows around 0.8200 may become a real possibility.
EUR/GBP Daily Chart, October 16, 2024
Source: TradingView.com (click to enlarge)
Support
- 0.8311
- 0.8250
- 0.8200
Resistance
- 0.8400
- 0.8425
- 0.8447
Follow Zain on Twitter/X for Additional Market News and Insights @zvawda
Content is for general information purposes only. It is not investment advice or a solution to buy or sell securities. Opinions are the authors; not necessarily that of OANDA Business Information & Services, Inc. or any of its affiliates, subsidiaries, officers or directors. If you would like to reproduce or redistribute any of the content found on MarketPulse, an award winning forex, commodities and global indices analysis and news site service produced by OANDA Business Information & Services, Inc., please access the RSS feed or contact us at info@marketpulse.com. Visit https://www.marketpulse.com/ to find out more about the beat of the global markets. © 2023 OANDA Business Information & Services Inc.


