- Gold prices fell in the US session after a positive European session, influenced by renewed US Dollar strength and concerns about China’s economic slowdown.
- Despite the pullback, ETF demand for gold remains strong, and geopolitical risks in the Middle East persist, suggesting buying pressure remains.
- From a technical analysis perspective, gold has broken out of a recent range, and further support and resistance levels are identified.
Most Read: USD/CHF Technical Outlook: Confluence Area Hints at Bullish Breakout
Gold prices tumbled in today’s US session having enjoyed a positive European session to say the least. The precious metal rallied from a low of 2628 in the European session to trade at a high of 2652 before the US open.
The US session however brought some renewed US Dollar strength, as Gold’s appeal appears to be waning. This was also the first US trading session since the National Development and Reform commission in China provided a briefing on the recent stimulus measures. The address today however failed to deliver any new measures and concern still lingers among many market participants.
China, the largest global consumer of metals, has dampened metals demand for over two years. Despite the Peoples Bank of China buying significant amounts of Gold there have been growing concerns of a widespread economic slowdown, especially the property sector crisis, has pressured copper and other industrial metals. Despite numerous property support measures this year, they have yet to significantly boost metals demand.
This renewed concern around China could not have come at a worse time for Gold Bulls. The aggressive repricing of rate cuts over the last few days coupled with the lack of response to the Iranian missile attack has formed the perfect cocktail for a pullback in Gold prices.
The question is whether this is the end of the bullish rally?
ETF Demand Remains Strong and Geopolitical Risks Remain
That is a very nuanced question given the various factors at play. For one though, the Middle East crisis is far from being resolved and the chance of escalation is certainly higher following the Iranian missile attack last week. There is bound to be an Israeli response which Iran has vowed will be met by a new attack as well.
These dynamics mean the Middle East situation could still blowover reigniting the safe haven appeal of Gold. Looking even further down the line, the World Gold Council September report was released today.
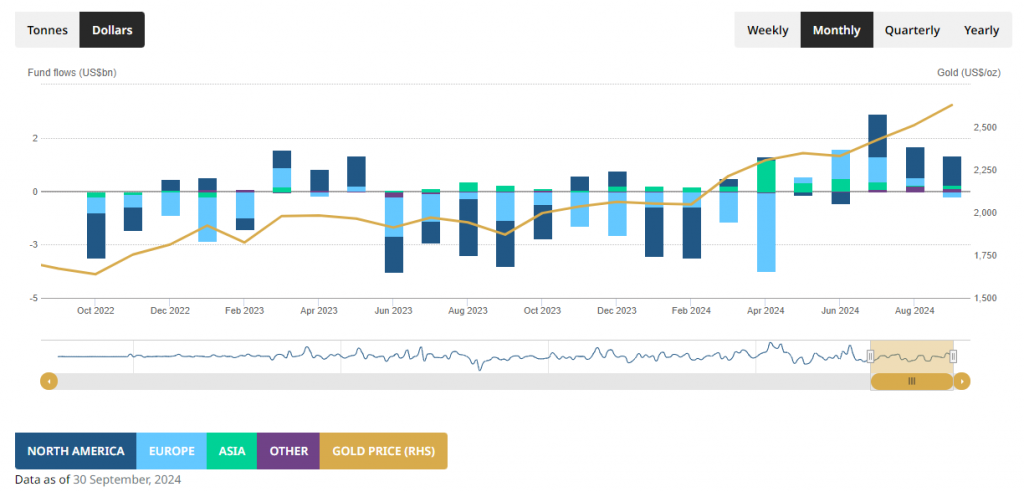
According to the latest World Gold Council (WGC) report, net ETF inflows increased again in September. ETF flow levels are often seen as a strong indicator of future demand trends. Gold-backed ETFs added 18 tonnes of gold in September, bringing total holdings to 3,200 tonnes. This led to cumulative inflows of $1.4 billion for the month, marking the fifth consecutive month of inflows.
This data follows similar trends in August, when Gold ETFs saw $2.1 billion in inflows, and July, which recorded $3.7 billion—the highest since April 2022.
Source: WGC Report (click to enlarge)
This coupled with the World Gold Council survey of Central Banks earlier this year hint that Gold demand is to remain strong in the medium to longer term. This would suggest that support for Gold remains and thus the current pullback could just be another false dawn. Either way i am intrigued to see how far today’s pullback may run.
Economic Data Ahead
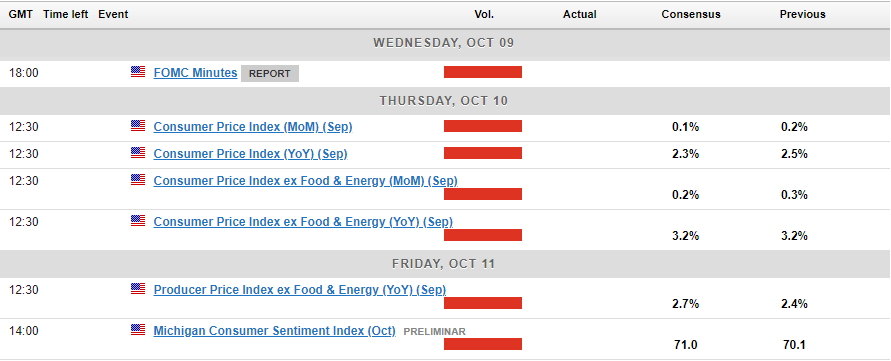
FOMC minutes will be released tomorrow in what I expect to be a non-event following the jobs data release last week. The Fed meeting on September 18 would likely have been dominated by concern around an ailing labor market which last week’s jobs report put to bed for the time being.
US CPI on Thursday is likely to be the next major market moving event, however tomorrow’s list of Fed Speakers may also contribute to some volatility.
For all market-moving economic releases and events, see the MarketPulse Economic Calendar. (click to enlarge)
Technical Analysis Gold (XAU/USD)
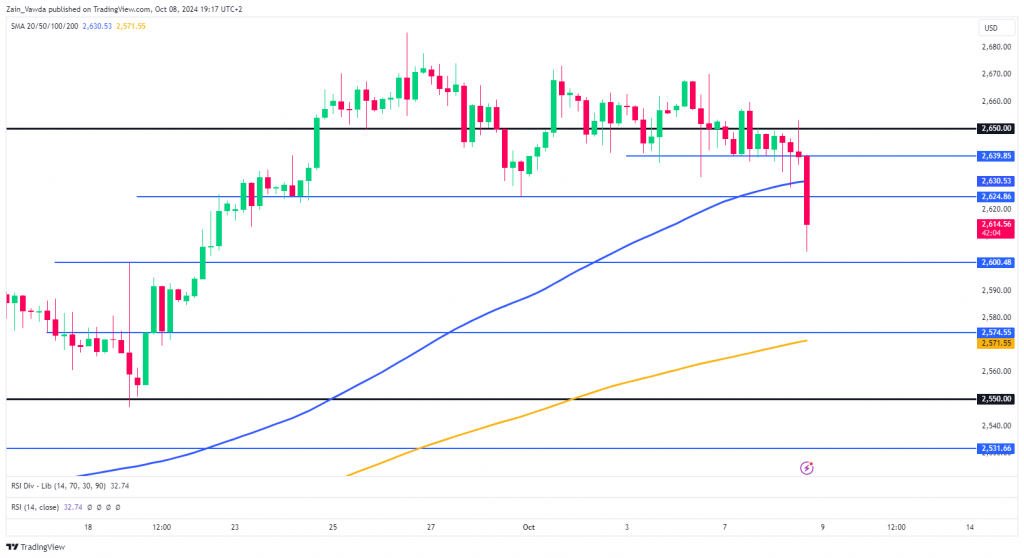
From a technical analysis standpoint, Gold had been caught in a tight range of around $30 since the start of October. There were brief tests below the 2640 handle in recent days but the four-hour candle always closed back inside the range low at 2640.
The breakout today has been quite aggressive with Gold reaching a low around the 2604 handle before bouncing to trade around 2614 at the time of writing. As mentioned technically Gold is due for a deeper pullback but the fundamental risks continue to underpin prices and keep selling pressure at bay.
If the selloff continues tomorrow, immediate support rests around 2600 before the 2574 handle comes into focus. 2574 could prove a tough hurdle to clear as just below it rests the 200-day MA making this a key area of confluence that could find some buying pressure.
Alternatively, a recovery from here may face a challenge at 2624 before the 100-day MA at 2630 becomes key. Beyond that and the previous H4 range low at 2640 could be key for bulls to regain control of the narrative moving forward.
GOLD (XAU/USD) Four-Hour (H4) Chart, October 8, 2024
Source: TradingView (click to enlarge)
Support
- 2600
- 2574
- 2550
Resistance
- 2624
- 2630
- 2640
Follow Zain on Twitter/X for Additional Market News and Insights @zvawda
Content is for general information purposes only. It is not investment advice or a solution to buy or sell securities. Opinions are the authors; not necessarily that of OANDA Business Information & Services, Inc. or any of its affiliates, subsidiaries, officers or directors. If you would like to reproduce or redistribute any of the content found on MarketPulse, an award winning forex, commodities and global indices analysis and news site service produced by OANDA Business Information & Services, Inc., please access the RSS feed or contact us at info@marketpulse.com. Visit https://www.marketpulse.com/ to find out more about the beat of the global markets. © 2023 OANDA Business Information & Services Inc.


