- Wall Street indexes paused after Wednesdays rally as Core PPI came in hot.
- Moderna shares plunged 17.8% due to lower-than-expected sales projections.
- Nasdaq 100 shows potential for upward movement, but technical hurdles persist.
Most Read: Gold (XAU/USD) Flirts with All-Time Highs. Will US CPI Prove the Catalyst for a Breakout?
The major Wall Street Indexes have all taken a breather today following a significant rally on Wednesday. Markets digested the PPI print today which followed its CPI counterpart in that the core print came in hotter than expected.
The data comes as many investment banks and analysts have warned of late that rate cuts may not be as aggressive as the markets are expecting. The ECB delivering a 50 bps cut today may have emboldened some market participants but the release of the US PPI just 15 mins later kept any bullish interest in check.
In August 2024, factory gate prices in the US rose by 0.2% compared to the previous month, after being flat in July, which had been revised downwards. This increase was higher than the expected 0.1% rise.
Core producer prices followed in the same vein as core CPI in the United States, which exclude food and energy costs, rose by 0.3% over a month in August 2024, following a revised 0.2% fall in the prior month and compared with forecasts of a 0.2% increase. On an annual basis, core producer inflation was 2.4% in August, up from a downwardly revised 2.3% in July but slightly below market estimates of 2.5%.
On an individual stock front, Shares of Moderna, trading under MRNA.O, plummeted by 17.8%, reaching their lowest point since November during intraday trading. This significant drop made Moderna the biggest loser on the S&P 500, following the company’s sales projection for the next year, estimated between $2.5 billion and $3.5 billion, which fell short of analysts’ expectations.
Top Gainers and Losers – S&P 500
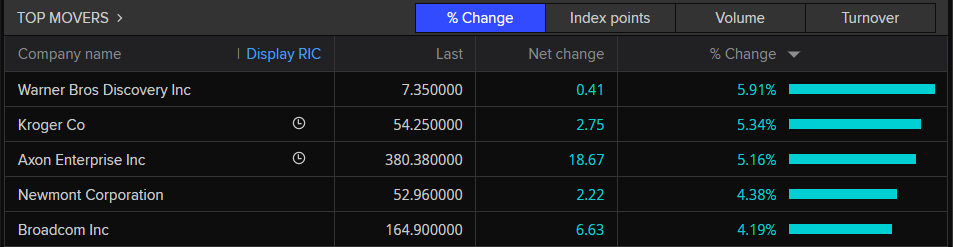
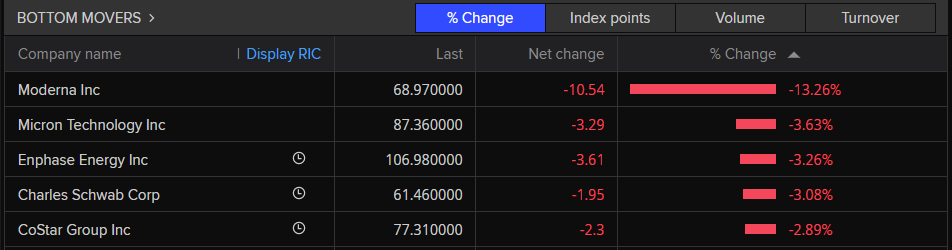
Source: LSEG Workspace (click to enlarge)
Following the US data this week markets appear more cautious as it appears that rate cuts from the Federal Reserve may not be as aggressive as hoped. Markets are now pricing in a 77% probability that the Fed will deliver a 25 bps cut next week, the question is how much of that may already be priced in?
Tech stocks rallied aggressively yesterday and were largely responsible for the rally in both the Nas100 and the S&P 500. Today however we are still seeing gains in some tech stocks but the magnificent 7 are a little more steady in comparison to yesterday and could in part explain the lack of movement in US Indexes.
Nasdaq 100 Heatmap
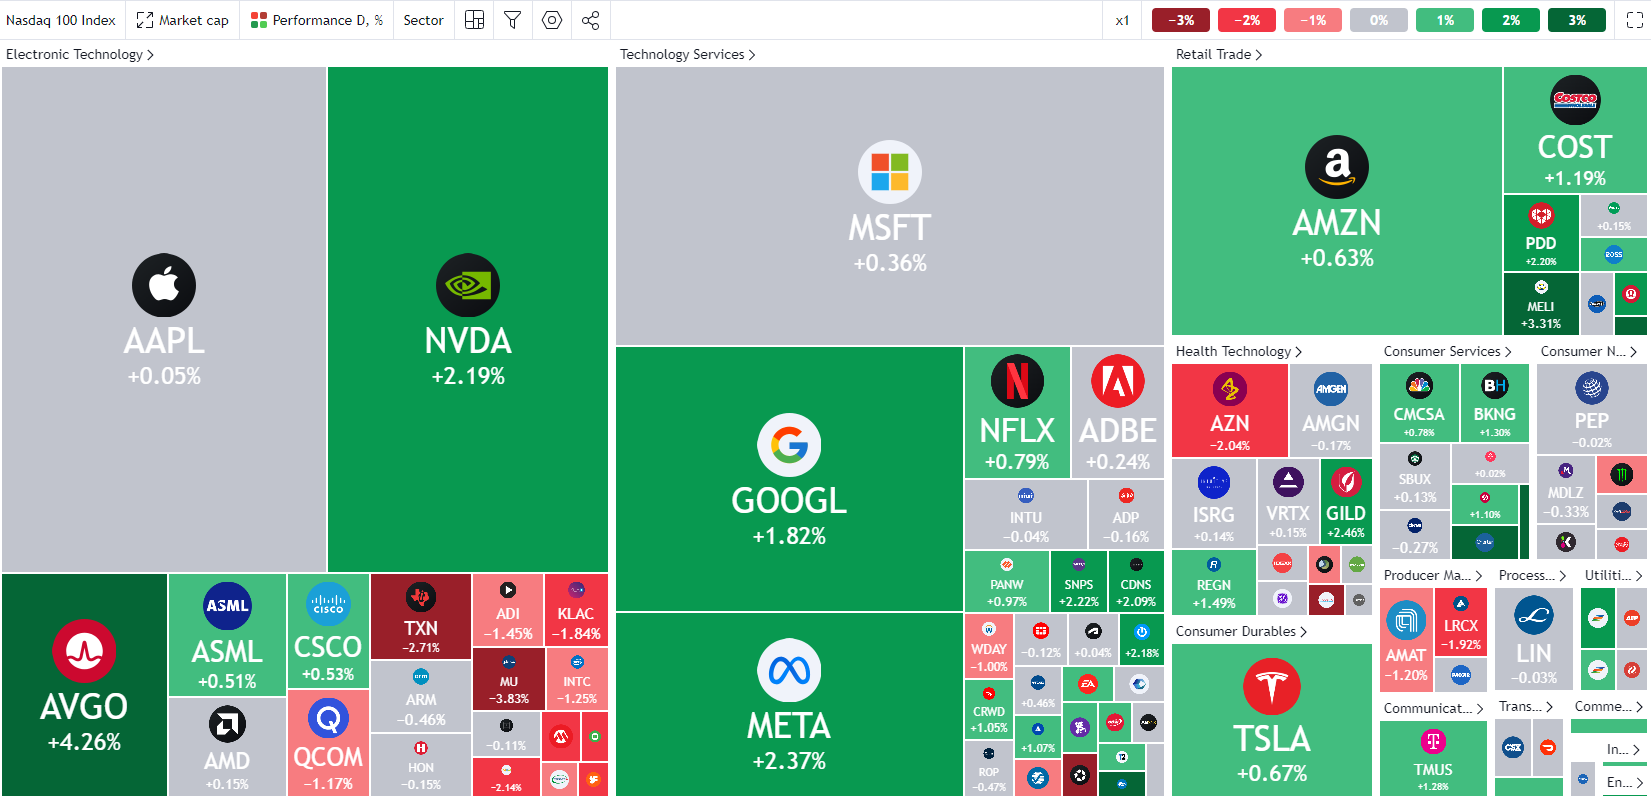
Source: TradingView (click to enlarge)
Technical Analysis
NASDAQ 100
From a technical standpoint, the Nasdaq 100 has experienced a remarkable performance this week, heading towards its fourth straight day of gains. The recent daily close above the 100-day moving average suggests potential for continued upward movement.
However, there are technical challenges ahead, including a descending trendline and the previous swing high near the 19,600 level. This area is a significant confluence zone that needs to be surpassed, and breaking through the trendline might propel the index toward the psychological 20,000 mark.
A concern remains that although we’re seeing a four-day bullish streak, the Relative Strength Index (RSI) has just crossed above the 50 mark, indicating that further upward potential exists. Reflecting on the past, the previous rally starting on August 8 saw eight consecutive days of bullish movements before a downturn occurred. Could we see a similar pattern leading up to next week’s FOMC meeting?
NASDAQ 100 Daily Chart, September 12, 2024
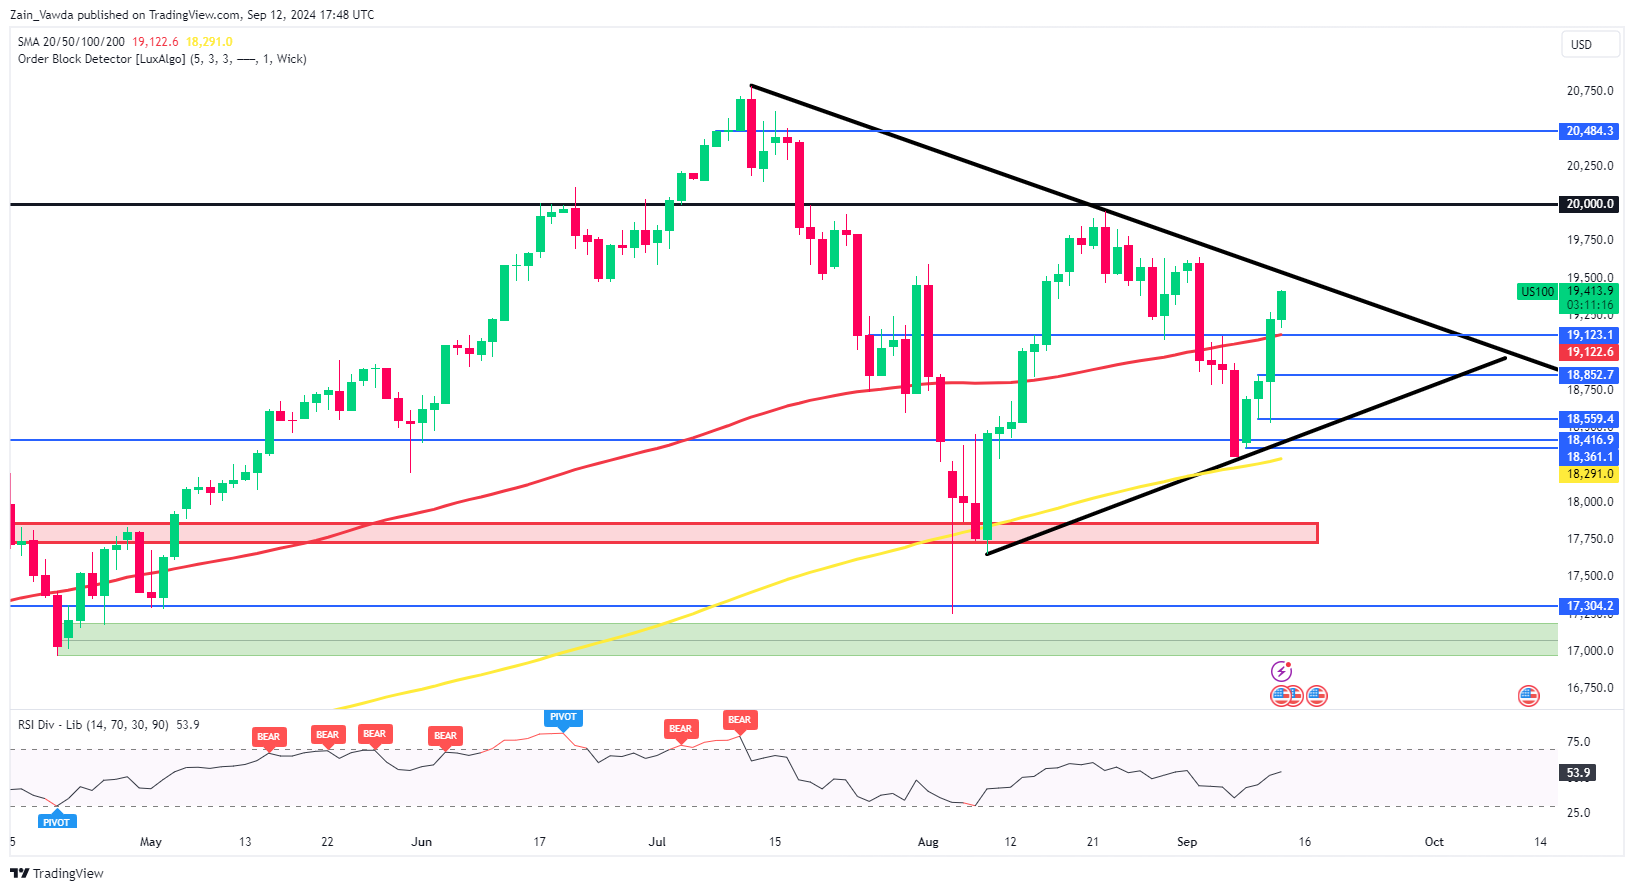
Source: TradingView (click to enlarge)
Support
- 19123
- 19000
- 18850
Resistance
- 19600
- 19850
- 20000
Follow Zain on Twitter/X for Additional Market News and Insights @zvawda
Content is for general information purposes only. It is not investment advice or a solution to buy or sell securities. Opinions are the authors; not necessarily that of OANDA Business Information & Services, Inc. or any of its affiliates, subsidiaries, officers or directors. If you would like to reproduce or redistribute any of the content found on MarketPulse, an award winning forex, commodities and global indices analysis and news site service produced by OANDA Business Information & Services, Inc., please access the RSS feed or contact us at info@marketpulse.com. Visit https://www.marketpulse.com/ to find out more about the beat of the global markets. © 2023 OANDA Business Information & Services Inc.

Zain Vawda
He has spent the last 3 years in an analyst role honing his skills across various financial domains, including technical analysis, economic data interpretation, price action strategies, and analyzing the geopolitical impacts on global markets. Currently, Zain is advancing in obtaining his Capital Markets & Security Analyst (CMSA) designation through the Corporate Finance Institute (CFI), where he has completed modules in fixed income fundamentals, portfolio management fundamentals, equity market fundamentals, introduction to capital markets, and derivative fundamentals.
He is also a regular guest on radio and television programs in South Africa, providing insight into global markets and the economy. Additionally, he has contributed to the development of a financial markets course approved by BankSeta (Banking Sector Education and Training Authority) at NQF level 6 in South Africa.
Latest posts by Zain Vawda (see all)
- Markets Weekly Outlook – S&P 500 in Focus as Markets Brace for Holiday Lull - 20 December 2024
- Stagflation Fears and Soaring US Yields: S&P 500’s Next Move - 19 December 2024
- Brent Crude Oil Prices Toil as Market Awaits Fed Decision. Range Trading Ahead? - 18 December 2024