- The S&P 500 and Nasdaq 100 are on an 8-day winning streak, the longest of 2024.
- US share buyback figures for 2024 (through August 9) are on par with those of 2022, reflecting positive market sentiment.
- The Nasdaq has seen an 8-day winning streak, with a daily chart bias favoring the bulls; Key resistance hurdles lie ahead.
Most Read: Brent Crude – Oil Slides Into Key Support as Geopolitical Risk Takes a Backseat
The S&P 500 and Nasdaq 100 are on a 8-day winning streak, the longest streak of the year. This has brought the two Wall Street indexes up to the levels they were trading at prior to the early August selloff.
A lot has to do with improving sentiment as data of late seems to support a soft landing scenario. This all comes ahead of a much anticipated speech by Federal Reserve Chair Powell st the Jackson Hole Symposium on Friday.
According to recent polls by Reuters, a slim majority (54%) of economists now believe the Fed will cut rates by 25 bps each at the three remaining meetings in 2024. This has changed from a cumulative 100 bps cuts which were priced in last month.
We have already seen some whipsaw price action by both the S&P and Nasdaq following the open today as markets ponder whether this recent rally can continue. Both of the indexes are back at key levels, will they have what it takes to break through these hurdles?
Nasdaq 100 Early Session Heatmap
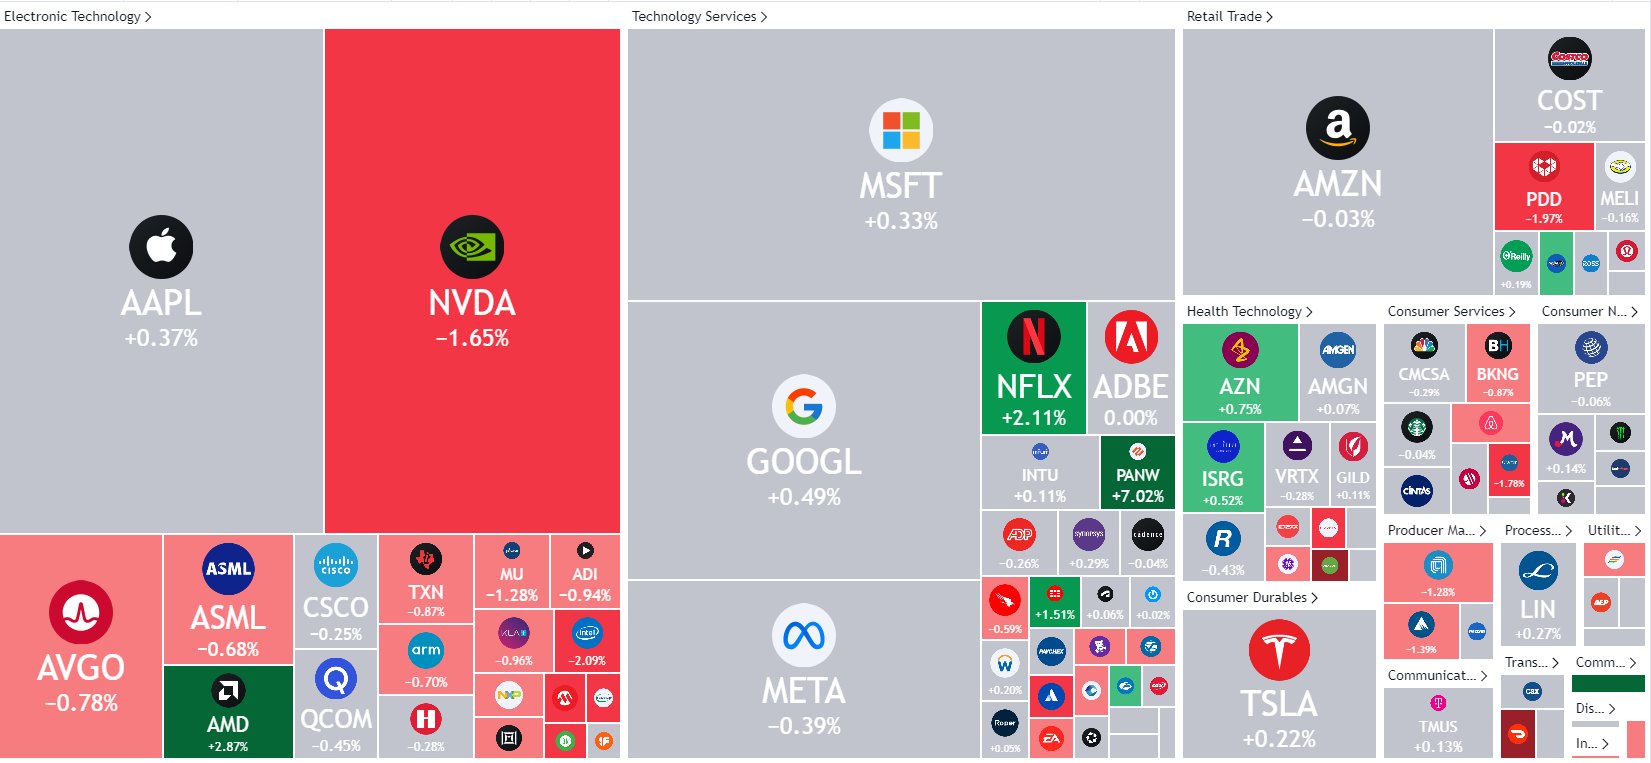
Source: TradingView (click to enlarge)
US Share Buybacks
I found an intriguing piece of data this week that seems to reflect market sentiment, US share buyback figures. Share buybacks are typically viewed positively in terms of sentiment, and the levels this year, up to August 9, are tied with those of 2022.
The data in the chart below tracks the share buybacks from 2011, and also shows the % change YoY.
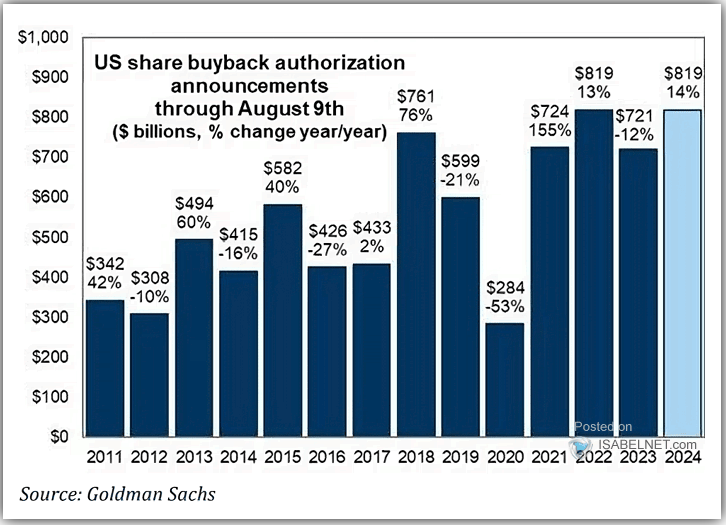
Source: Goldman Sachs,IsabelNet (click to enlarge)
The current fear and greed index has almost doubled over the past week. The index was languishing around 25 a week ago, now it is up to 49%. A further nod to the current market sentiment.
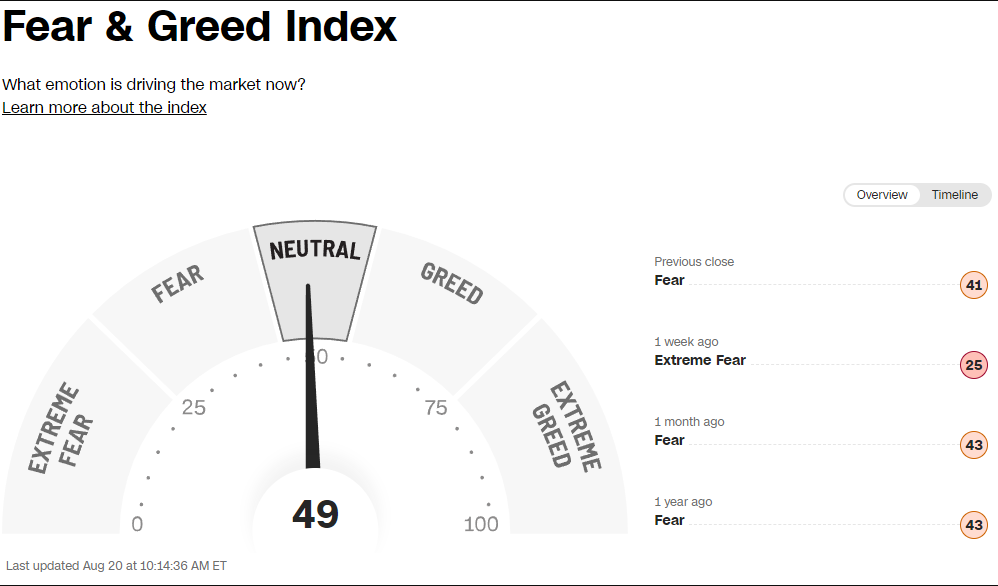
Source: FinancialJuice (click to enlarge)
Technical Analysis Nasdaq 100
From a technical perspective, the Nasdaq has embarked on an 8-day winning streak since August 8. Surpassing a swing high at 19460 has shifted the daily chart bias in favor of the bulls.
Earlier in the session, prices were rejected from the swing high resistance of July 23, around the 19,840 level. Beyond that, significant hurdles await, with the 20000 mark being a major one. Should this level be breached, resistance could be encountered near the 20400 mark.
On the downside, current prices find support at 19460. A break below this level could lead to a retest of 18871.
Nasdaq 100 Daily Chart, August 13, 2024
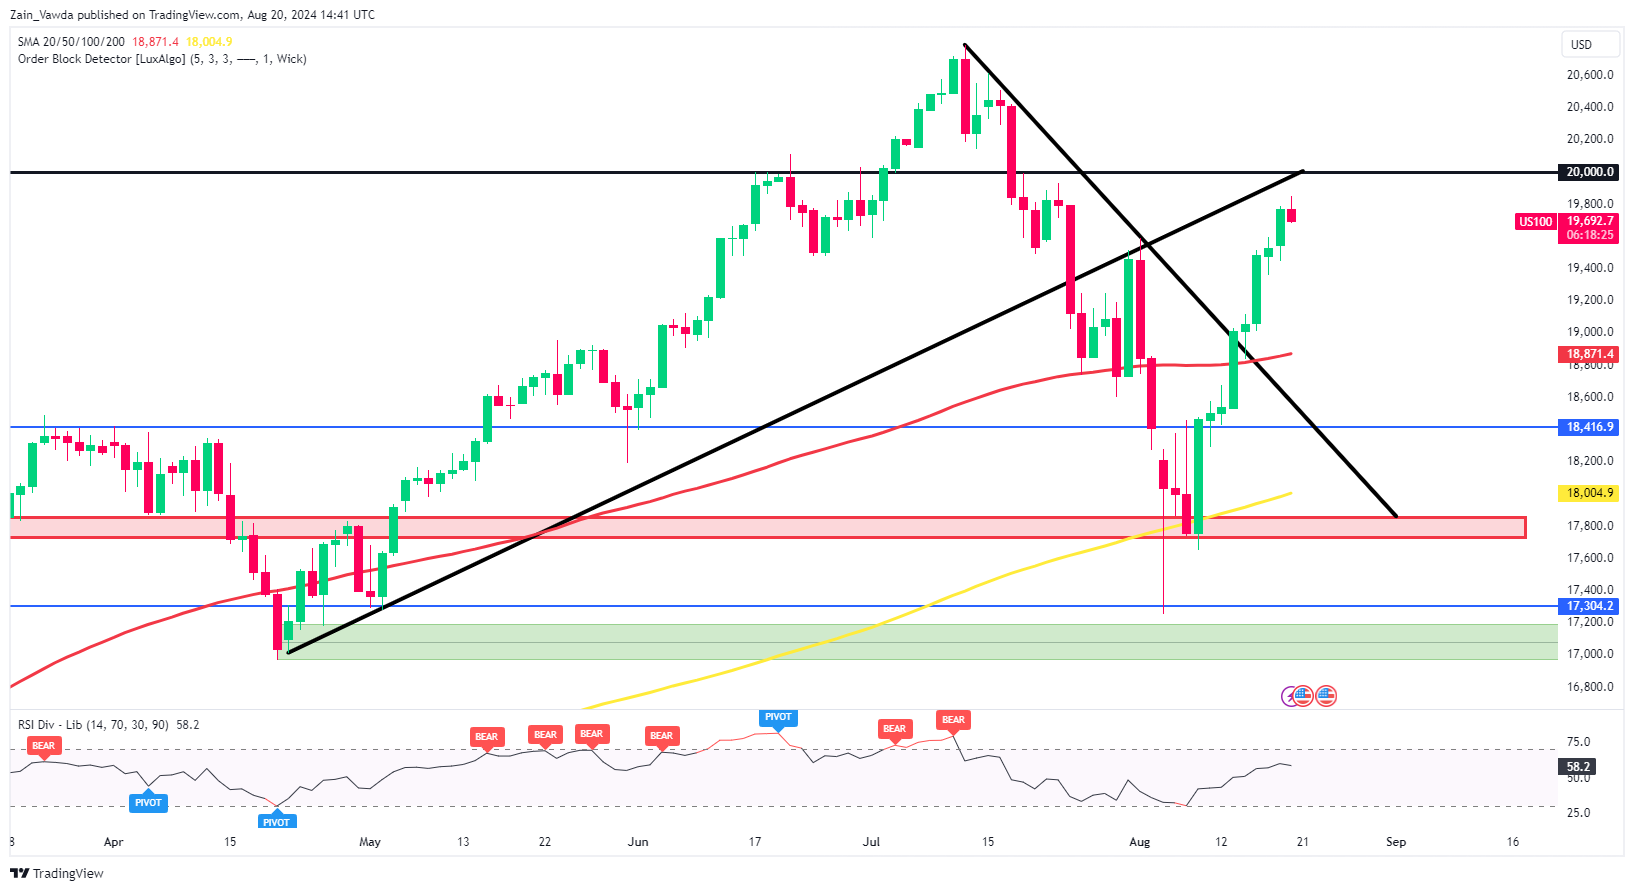
Source: TradingView (click to enlarge)
Support
- 19460
- 18871
- 18416
Resistance
- 19840
- 20000 (psychological level)
- 20400
Follow Zain on Twitter/X for Additional Market News and Insights @zvawda
Content is for general information purposes only. It is not investment advice or a solution to buy or sell securities. Opinions are the authors; not necessarily that of OANDA Business Information & Services, Inc. or any of its affiliates, subsidiaries, officers or directors. If you would like to reproduce or redistribute any of the content found on MarketPulse, an award winning forex, commodities and global indices analysis and news site service produced by OANDA Business Information & Services, Inc., please access the RSS feed or contact us at info@marketpulse.com. Visit https://www.marketpulse.com/ to find out more about the beat of the global markets. © 2023 OANDA Business Information & Services Inc.

Zain Vawda
He has spent the last 3 years in an analyst role honing his skills across various financial domains, including technical analysis, economic data interpretation, price action strategies, and analyzing the geopolitical impacts on global markets. Currently, Zain is advancing in obtaining his Capital Markets & Security Analyst (CMSA) designation through the Corporate Finance Institute (CFI), where he has completed modules in fixed income fundamentals, portfolio management fundamentals, equity market fundamentals, introduction to capital markets, and derivative fundamentals.
He is also a regular guest on radio and television programs in South Africa, providing insight into global markets and the economy. Additionally, he has contributed to the development of a financial markets course approved by BankSeta (Banking Sector Education and Training Authority) at NQF level 6 in South Africa.
Latest posts by Zain Vawda (see all)
- Markets Weekly Outlook – Fed Policy in Focus as US Inflation Lies Ahead - 10 January 2025
- NFP Preview: US Jobs Report & Market Impact - 10 January 2025
- USD/CHF Technical Outlook: Bulls in Charge as Potential Double Top Pattern Forms - 9 January 2025